Additional results are available for analyses run using the Autodesk Nastran solver. These results are not available, and the associated ribbon panel and commands do not appear, if you run the simulation using the native Autodesk Simulation Mechanical (SimMech) solver.
Nastran Contact Results
The following results are available from the Contact panel of the Results Contours ribbon tab. If you are using the classic user interface (Ribbon Style application option deactivated), the commands appear in the Contact fly-out menu within the Results pull-down menu. These Nastran contact results are applicable to linear and nonlinear stress analyses:
Pressure:
A nodal result indicating the normal contact pressure, in force per unit area, along the contact region. Pressure results are available for quadrilateral and triangular element faces. A positive result indicates compression and a negative result indicates tension.
Traction-X:
A nodal result indicating the in-plane contact traction, in force per unit area, along the contact region and acting in the local-X direction. Traction-X results are available for quadrilateral and triangular element faces. The direction of the X-vector is based on a local coordinate system, and this vector lies in the plane of the element face. The contact Pressure, Traction-X, and Traction-Y vectors are at a 90 degree angle relative to each other.
Traction-Y:
A nodal result indicating the in-plane contact traction, in force per unit area, along the contact region and acting in the local-Y direction. Traction-Y results are available for quadrilateral and triangular element faces. The direction of the Y-vector is based on a local coordinate system, and this vector lies in the plane of the element face. The contact Pressure, Traction-X, and Traction-Y vectors are at a 90 degree angle relative to each other.
Status:
A nodal result indicating the state of the part/surface interaction along the contact region. Status results are available for quadrilateral and triangular element faces. An integer value indicates the contact status, as defined in the following list:
- Open: No contact.
- Slide: Closed (in contact) with no friction defined.
- Stick: Closed (in contact) with friction included. Parts holding relative position (no slippage).
- Slip: Closed (in contact) with friction included and slippage occurring.
- Weld: Parts are bonded.
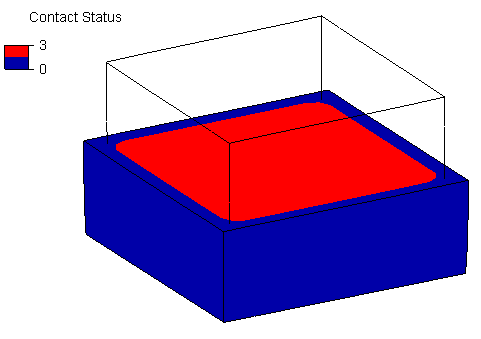
The vertical size of the legend and the number of tick marks adjusts automatically to show only the range of status integers present in the analysis results. Color blending might give a false impression of a contact status that is not actually present in the results. For example, the following image is of a model that only has status=0 (open) and status=3 (stick) results. However, the color blending across a single element width produces a band of orange, yellow, green, and cyan (color transition); though the nodal contact status result is never 1 or 2:
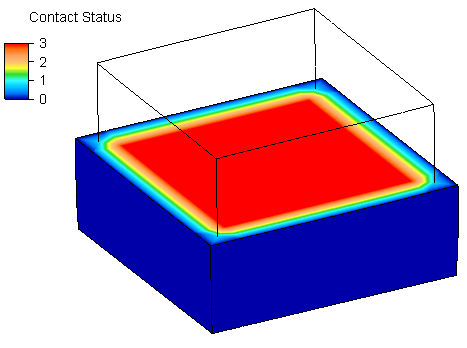
In such cases, you can customize the legend colors and the number of tick marks to display. The following version of the same image was produced using a Bi-color legend scheme and only two tick marks. It more closely indicates the presence of only two contact status results: