Use path plots to show the deflection of many nodes at the same time.
Any deflection result can be displayed as a path plot. Path plots are useful to track plane flatness or edge straightness.
To create a path plot:
- Click
 .
.
- Select the desired deflection result from the Available results list.
- Select Path Plot as the Plot type.
- Click Plot Properties, then the Mesh Display tab.
- Click Element lines for the undeformed part, and Opaque for the surface display (optional), to see the node locations clearly.
- Click OK.
- Pan and Zoom as necessary to see the nodes that you need to select.
- Pick the nodes you want to use to create the path plot.
- Click
 .
.
- Click the Path Plot tab and check Overlay with color plot.
- Click the Mesh Display tab.
- Click Off for the undeformed part and Transparent for the surface display.
- Display an anchor that relates to the path plot.
Note: If you use an anchor with a path plot, the path plot must be overlaid with the path plot for the anchor to be used.
Note: If possible pick as the first node in the path plot, a node that is used for the Anchor plane. Also select the other nodes that define the anchor (if possible). Using the same nodes in the Anchor and path plot, make the path plot nodes zero at that location.
In the following figure, one edge of the part has a path plot on it to see how much the edge moves in the Y-direction. The first and last nodes selected for the path plot are first two nodes used to define the anchor plane. The deflections at the anchor nodes are zero, making the path plot easier to interpret.
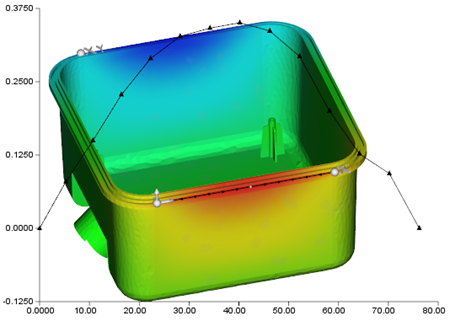
Path plot of the Y-Deflection