
From the menu on the left of the panel, select the display format of the temperature or displacement gradient (Blue-Green-Red, Blue-Red-Yellow, Grey-scale, Sepia, or Standard). Other display options are as follows:
- Banding – Display banded color results, instead of a continuous gradient, which is the default.
- Contour – Adds contour lines in between displayed color values.
- Legend – Select the display of the gradient in the window, and optionally add bands and contour lines to the legend. You can change the length and width of the legend by resizing its bounding box. To change a horizontal legend to vertical, click and drag the legend out of the window to the left or right; to change a vertical legend to horizontal, drag it out of the top or bottom of the window.

Click Plot Settings to open a dialog in which to control how the results are graphically represented in the display.
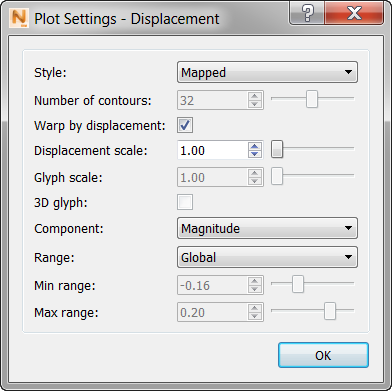
Experiment with these to see which settings provide the best display of the gradient for each part. Three Style options are available:
- Mapped is the most commonly used, as it shows a smooth color gradient. If you select Warp by Displacement, it will warp the visible results by the displacement vector. For a true depiction of modeled distortion leave the default value of 1.00. You can also move the Displacement Scale slider to see the displacement value exaggerated for greater visibility of parts with small distortion.
- IsoSurface can show temperature gradients well, and you can adjust the number of contours using the slider bar, up and down arrows, and typing directly into the dialog box.
- Vector displays small arrows, known as glyphs, on the part and build plate to show the direction and degree of particle deformation. This option is only available for vector results, such as Displacement. You can use the Glyph Scale controls to exaggerate the size of the glyphs by the multiple chosen with by this option. By default the display shows 2D glyphs, but you can change to 3D vector arrows by selecting the 3D glyph box.
If you want to make Plot Settings results easier to see, select Warp by Displacement, and exaggerate the distortion by setting a higher Displacement Scale value.
The Component options vary for different result types. For example, by default, the magnitude of displacement is shown in three dimensions. To display a single X, Y, or Z component of displacement, select the axis from the Component menu.
Three Range options are available:
- Global – This default option adjusts the scale to encapsulate the minimum and maximum values of the chosen results type over the entire history of the simulation.
- Local – This option adjusts the scale to the local increment minimum and maximum values.
- Specified – This option allows you to set the minimum and maximum range values manually.

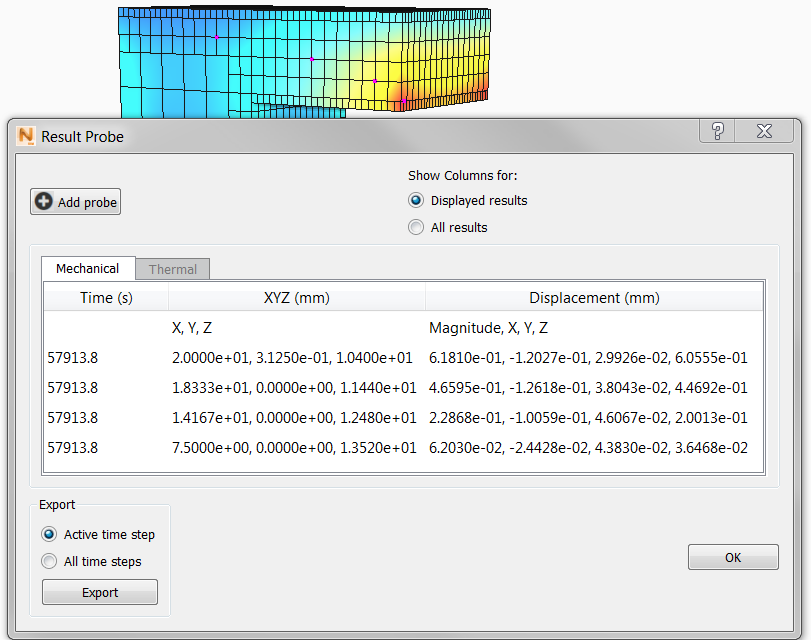
Click Result Probe to investigate how temperature, displacement, and other results for specific points in the part, build plate, or support structure. Several point selection methods are available:
- Click on a point of interest, and a bright marker appears in the view, while the Result Probe dialog displays numeric values for that point.
- If you know the coordinates of a point, click Add probe and enter the X, Y, and Z values.
- Ctrl-click a series of points on a surface, and the Result Probe dialog displays the values for each point in a table.
- Hold down the left mouse button and draw a rectangular window around some points. The window is projected through the part; values are added to the table for the points you see and others through the part.
The table below shows only displacement results for the four points selected in the figure. If you select All results, the table expands to display all available results for each point. In this case, expand the dialog or scroll to see additional data columns.
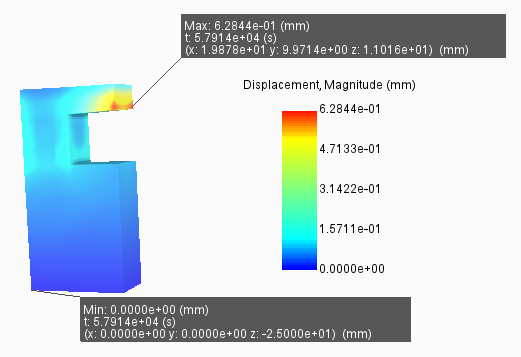
Select the Maximum and Minimum check boxes to identify and label the points with maximum and minimum values of the displayed attribute. The figure below shows an example for displacement.
You can export the Result Probe table values in CSV format for use in spreadsheets, plots, and other forms of post-process analysis.

For View Logs information, see View Logs.

Click Record to create an AVI video of animations in the Simulation Utility window. You may want to use this to capture the build progress as the camera orbits the geometry or zooms in to areas of interest. The recording does not capture dialog boxes, only the object model. Press Record again to stop the recording.