- Right-click on Results and select New.
- The figure below shows the default template options.
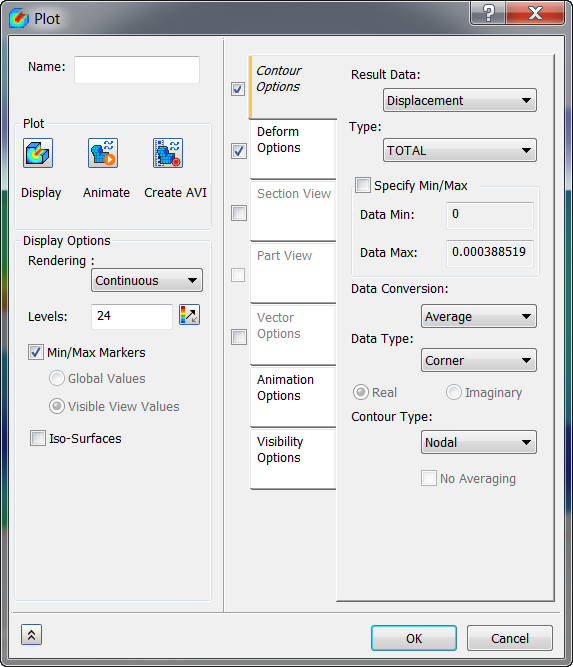
- You can name the plot and check or uncheck various display types on the left side of the dialog window.
- In the Contour Options section, Result Data can be chosen to be displayed. Data Max and Data Min values can be adjusted to modify the contour plot by checking the Specify Min/Max checkbox.
- In the Deform Options section, different deformation Vector options can be chosen to be displayed. The Deformation Scale can be set to Percent or Actual.
- Various Rendering types are available such as Continuous, Fringe etc.
- At the top, enter the
Name
Total Deformation.
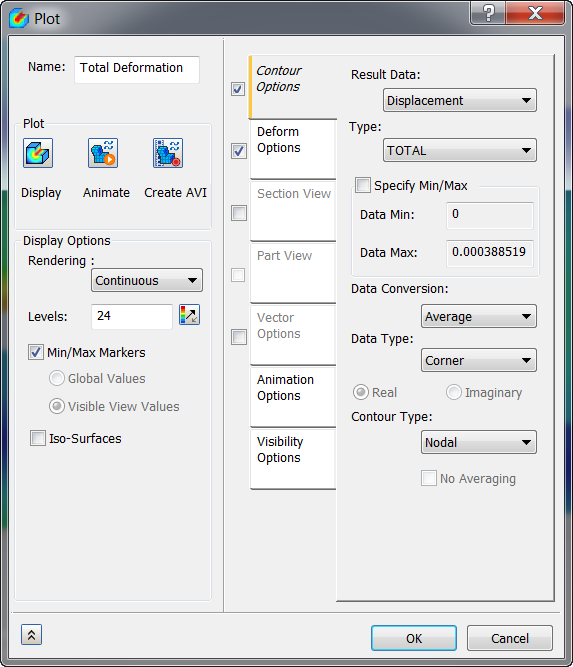
- Click OK. The new plot name is added to the Results node.
 Results Plot Description:
- If the Name box is empty and you click OK, the Result vector name is added automatically.