We will now review the von Mises stress results, a stress tensor result, and plate/shell display options available in the Results environment.
- Click
 Results Contours
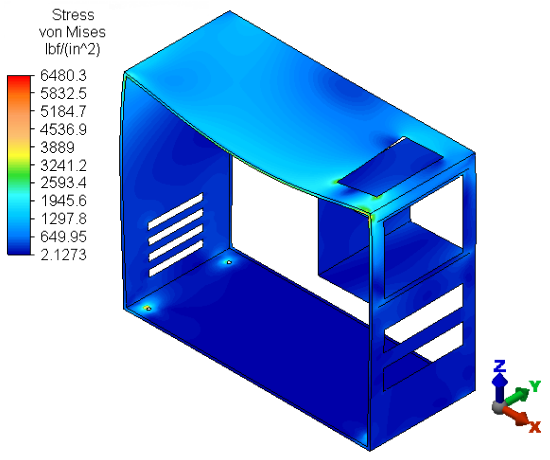
  Stress von Mises. The stress results appear as shown in the following image.
- Click
 Results Contours Settings Plate/Shell Options. Notice that, by default, the
Total Stress/Strain is displayed, and the
Two-Sided Display
option is set to
Both. Alternatively, you can view only the portion of the total stress or strain that is due to bending. Similarly, you can view only the membrane stress/strain (that is the stress/strain associated with pure in-plane tension or compression.
Results Contours Settings Plate/Shell Options. Notice that, by default, the
Total Stress/Strain is displayed, and the
Two-Sided Display
option is set to
Both. Alternatively, you can view only the portion of the total stress or strain that is due to bending. Similarly, you can view only the membrane stress/strain (that is the stress/strain associated with pure in-plane tension or compression.
When bending is present, stress and strain at the top of a plate/shell element has a different value than at the bottom. Even though the actual elements only have one surface, the color or the contour plot is rendered differently when the top and bottom sides are facing you (assuming the default Both Sides option is active. For this reason, the maximum stress or strain might not be visible from a particular model viewpoint. You can reverse the sides or force the colors to be based on the top or bottom side regardless of the viewpoint.
- Activate the
Bending Stress/Strain option. Notice the change in the appearance (particularly near the cutout in the top of the case) and the new legend range:
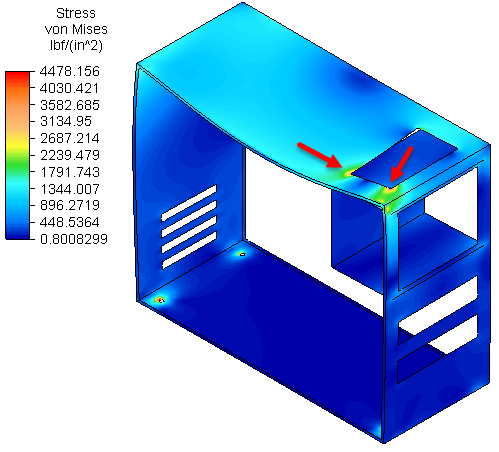
For now, leave the Plate Display Options dialog open.
- Activate the
Bending Stress/Strain option. Notice the change in the appearance (particularly near the cutout in the top of the case) and the new legend range:
- Click
 Results Contours Stress Tensor XX Component. This contour plot clearly demonstrates the reversal in the sign of the stress tensor between the top and bottom faces of the plate elements (due to bending). The model should resemble the left image in the table below.
- Activate the
Reverse Sides in Plot sub-option under the
Both Sides
option. The display should now resemble the right image in the table:
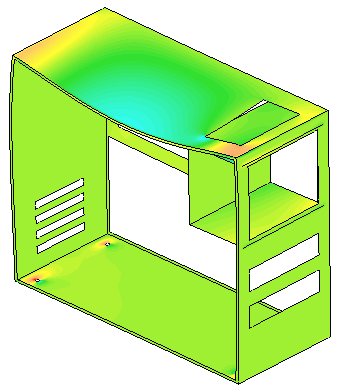
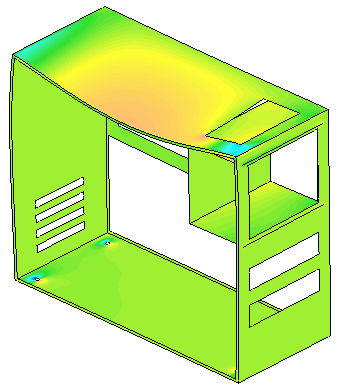
Default Plate/Shell options (Sides NOT Reversed) Reverse Sides in Plot option Activated A positive tensor result indicates tensile stress, and a negative tensor result indicates compressive stress. The plotted colors and legend values match the actual stress or strain only when the sides are not reversed.
- Activate the
Reverse Sides in Plot sub-option under the
Both Sides
option. The display should now resemble the right image in the table:
This tutorial is now complete.