Viewing contour plots of specific state variables is the best way to evaluate the structural performance of the coupon. In particular, we will examine SVAR1 (rupture state) and SVAR9 (matrix tangent elastic modulus).
- After the job has completed, open the database file coupon_ame.db.
- With the database open, click and locate the coupon_ame.rst file.
- Click
- Click and select the 0.0 (off) radio button. Click OK.
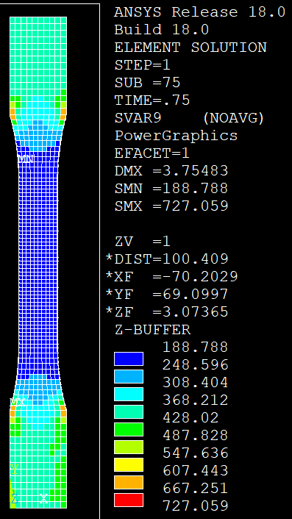
- Enter PLESOL, SVAR, 9 into the command prompt to create a contour plot of SVAR9. SVAR9 represents the tangent elastic modulus of the matrix constituent.
- Step through the analysis () and monitor SVAR9 as the tensile displacement load is applied to the coupon. Notice how the values of SVAR9 in the notched gage region are much lower than the remainder of the coupon. This indicates a large amount of plasticity, or material softening.
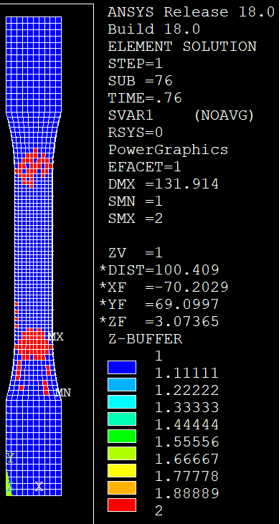
- Now enter PLESOL, SVAR, 1 into the command prompt to examine SVAR1, the rupture state of the composite part. A value of 1.0 indicates the composite has not failed. A value of 2.0 indicates the composite has failed.
- By monitoring SVAR1 throughout the load history, we see that failure progresses very quickly between Step Time = 0.75 and 0.76.