Viewing contour plots of specific state variables is the best way to evaluate the structural performance of the radiator tank. In particular, we will examine SDV13, the matrix failure index and SDV1, the rupture state.
- After the job has completed, open Abaqus/Viewer and click from the main toolbar and open radiatortank_ame.odb. This will open the output database file and switch to the Visualization module. The undeformed tank appears in the viewport.
- Click to display the contour plot.
- Now select SDV13 from the list of output variables (Result > Field Output). SDV13 represents the failure index of the matrix material.
- Step through the analysis from beginning to end and monitor SDV13 as the pressure is applied to the tank. SDV13 will give us an indication of how close the matrix material is to failure.

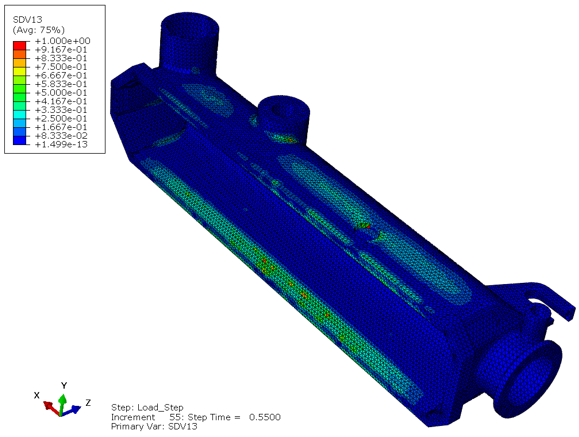
When the failure index reaches 1.0, failure has initiated. The first indication of failure occurs at step time 0.55 s.
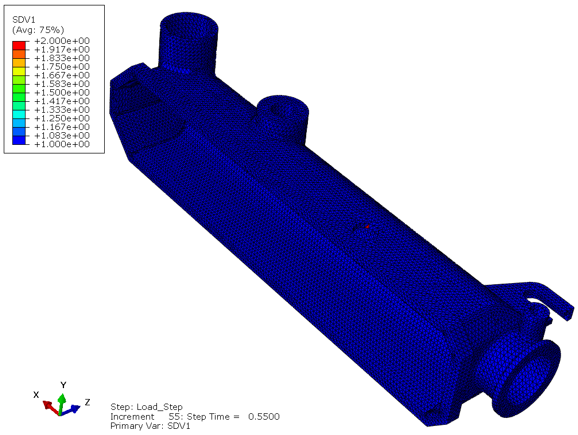
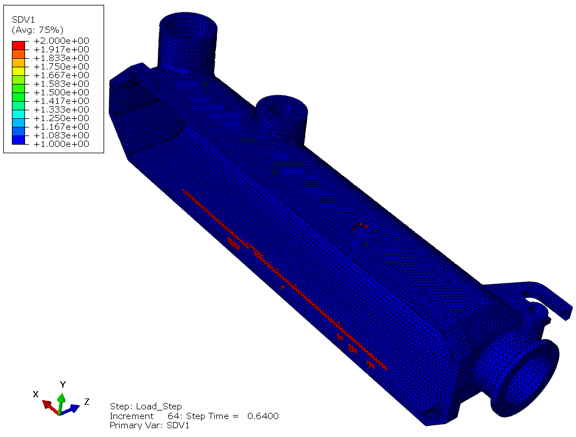
- Now select SDV1 from the list of output variables. SDV1 represents the rupture state of the composite material. A value of 1 means no rupture and a value of 2 means the integration point has ruptured.
- Step through th analysis to identify how failure progresses in the tank.