Stress-strain plots are commonly used as tools to determine the global stiffness response of a structure. They are particularly useful for progressive failure analyses as they are a simple means of determining how the structure behaves as failure initiates and progresses. To generate a stress-strain plot, data must be extracted from the output file.
We have provided a Python script that makes it very simple to extract the stress-strain data from the Abaqus output file. When run, the script will create a text file that contains the stress-strain data. To run:
- Open the command prompt used to run the input file.
- Make sure the coupon_ame.py file is present in the directory containing your Abaqus .odb file. (You need to navigate to this directory if you haven't already).
- Enter the following command to run the post-processing script (in this case with Abaqus 2017):
>>abq2017 viewer noGUI=coupon_ame.py
When the post-processing script completes, you will see a file named coupon_ame_output.txt that contains the stress-strain data for the ASTM coupon. The stress is calculated by dividing the reaction force by the cross-sectional area of the coupon. The strain is calculated by taking the difference in displacements at each end of the gage section of the coupon and dividing by the original length of the gage section. Now you can enter this data into a spreadsheet and compare with the experimental stress-strain inputs for the Extron 3019 HS material.
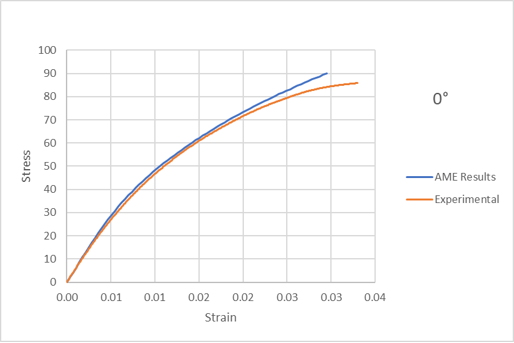
We can see a very good agreement between the experimental data at zero degrees and the outputs from Advanced Material Exchange. Keep in mind, Advanced Material Exchange uses a stress-based failure criterion, so the fact that we get a very similar ultimate stress for each curve gives us confidence that the tool can be used reliably going forward.
45 and 90 Degree Curves
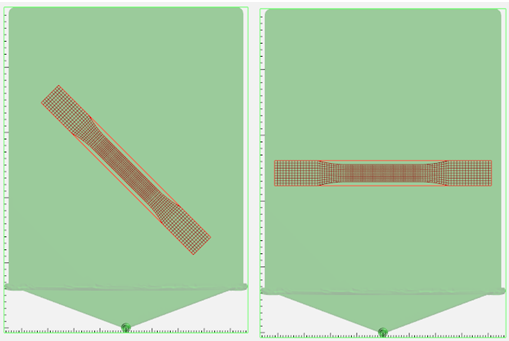
We can now repeat the Advanced Material Exchange steps outlined in this tutorial, rotating the coupon by 45 and 90 degrees about the z-axis with the Interactive Alignment tool, to compare with the experimental data at those respective angles.
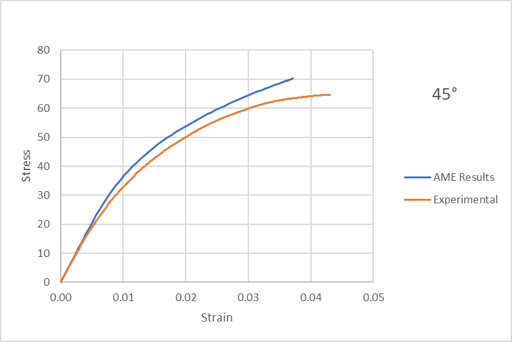
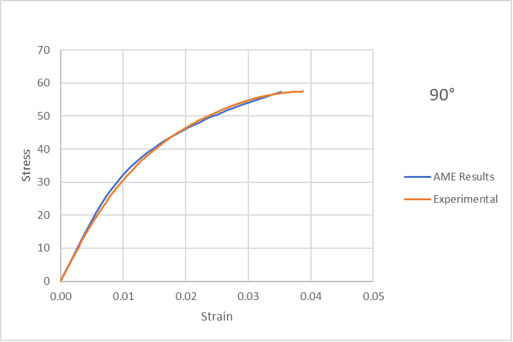
Advanced Material Exchange does a good job of capturing the plasticity response for both the 45 and 90 degree curves.