Once you have analysed the grain profile, you can make adjustments to the profile. You can adjust spatial degrain parameters, or apply a temporal degrain that can include previous or subsequent frames in the shot. A curve is displayed for each colour channel. You can manually adjust a response curve for the gain of each colour channel in the Curve Editor.
Adjusting Spatial Degrain Settings
Fine-tune grain removal by changing the spatial degrain parameters in the Degrain Settings panel. It contains:
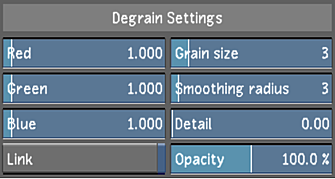
- Red
- Slider sets the gain for red channel colour values.
- Green
- Slider ets the gain for green channel colour values.
- Blue
- Slider ets the gain for blue channel colour values. For film scans, the grain is often greater in this channel.
- Link
- Click to change gain values proportionally for all three colour channels.
- Grain size
- Slider sets a value in pixels that is proportional to the size of the grain. The default value is 3, but may be higher for 4K images.
- Smoothing radius
- Sets the blur radius. For smoother results, a higher value will add more pixels to the blur, but increase processing time.
- Detail
- Slider sets the amount of detail to preserve when the Smoothing Radius is set to a high value. It is recommended you enter 0.05 to 0.15 as an initial value.
- Opacity
- Slider sets the level of opacity between the source image and the output with the applied grain filter.
Applying Temporal Degrain Settings
If you degrain the source image (using the Degrain menu in the Input menu), you can include temporal degrain operations to the grain filter, by comparing the pixel data in past or future frames. These options yield best results when frames include many static or slowly moving objects in the image. Temporal options will improve grain removal results, but it will also increase processing time.
To use temporal degrain, in the Temporal Options panel, enable one or both states:
- Past: include pixel data from previous frames in temporal processing.
- Future: include pixel data from subsequent frames in temporal processing.
Adjusting the Response Curves
Response curves represent the noise intensity for each colour channel. Modify the red, green, or blue response curves to fine-tune the degrain. You can add vertices to a curve to refine your adjustments.
To modify the red, green, or blue curve:
- To display the response curve, click Show Curves.
- Show the response curve you want to modify by clicking the button corresponding to the colour of the curve.
The selected curve is highlighted.
- Sample the colour you want to use as a reference for your adjustments.
Red, green, and blue vertical lines representing the colour channels are plotted on the curve.
- Do one of the following:
- To add a vertex to the curve, place the mouse cursor over the area on the curve where you want to add the vertex and press A.
- To lock the curve in place while adding a vertex, press Shift+A on the curve.
- Click a vertex to display its tangent handle and then drag the handle to adjust the curve. You can also adjust the curve by dragging the vertex.
- Modify the curve until you are satisfied with the results:
- To select a vertex, click it. To select several vertices, draw a selection box around them.
- To move one or several selected vertices, drag a selected vertex. To restrict vertex movement to the Y axis, press Shift while moving the mouse. To restrict vertex movement to the X axis, press Shift+Alt while moving the mouse.
- To delete vertices, select them and then press D.