One of the leading causes of equipment failure in harsh flow environments is surface erosion due to high-velocity liquid flow impingement. Understanding where erosion may occur is essential for designing for greater durability and longer service life.
Contaminants such as sand, quartz, and fly ash cause material erosion as they recirculate and impinge against valves and other machinery. In the oil and gas industry, engineers evaluate this Ductile erosion based on the "mesh size" of the particle. The mesh size is the largest particle size that is likely to be found in a system. This phenomenon is also referred to as "washout."
Autodesk® CFD uses Lagrangian particle tracking with the Edwards Model to compute erosion. A low particle concentration assumption (not a slurry erosion model) is employed, and results are presented as a scalar result quantity. This facilitates design comparison, and removes the guesswork from interpreting erosion predictions.
The erosion model uses angle of attack bounce data and the Brinell material hardness to compute the material volume removal rate. This approach qualitatively identifies areas subject to erosion. It illustrates the relationship between the flow and erosion trends, which can lead to erosion reduction through design improvements.
Erosion Example
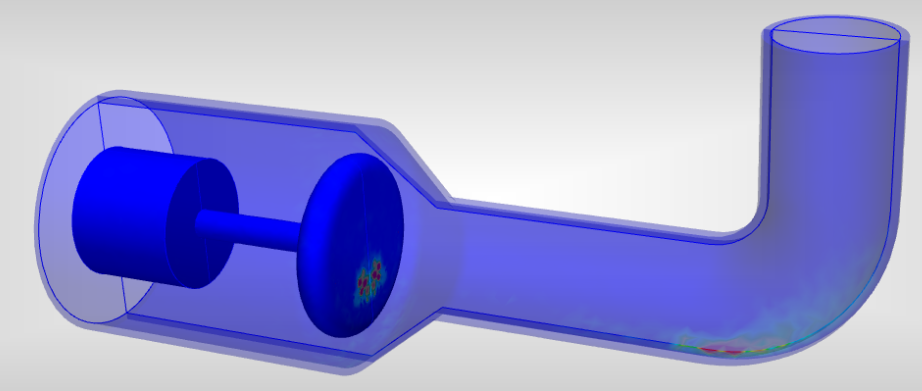
The Erosion Rate result appears on particle traces and on wall surfaces. Traces show the interaction between the flow and solid obstructions. The erosion scalar distribution shows the relative severity of the erosion.
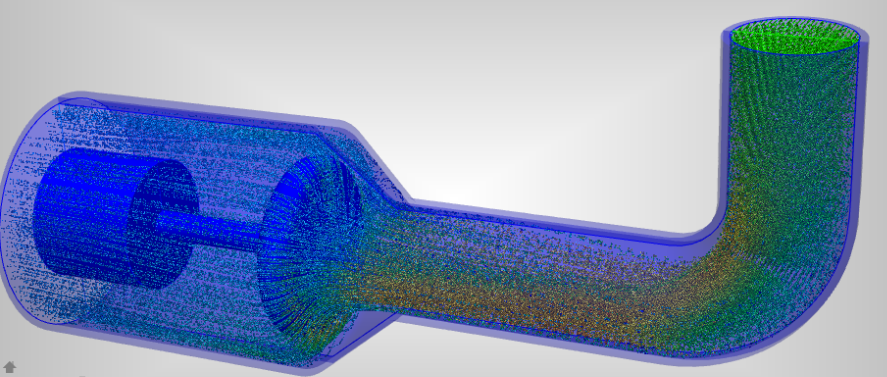
In the following example, flow enters a valve, turns, and impinges on the pressure face of the poppet. These traces do not include mass, and simply illustrate the flow distribution:

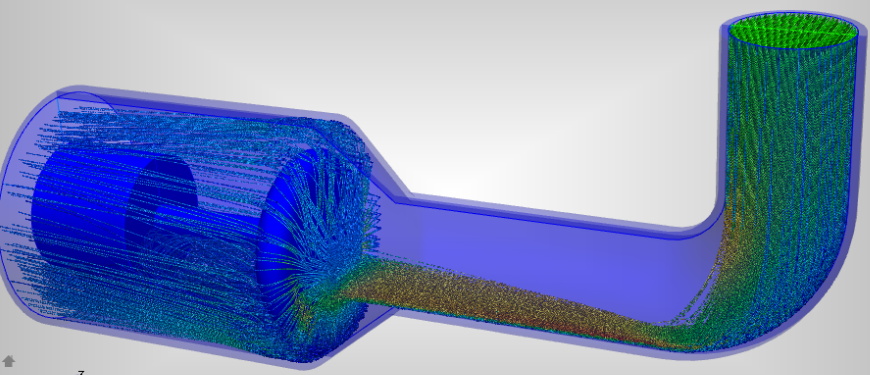
When mass is enabled on the traces, we see how particles in the flow impinge on the outside area of the bend and on a relatively small area of the poppet face:

The areas of highest erosion occur on the outside radius of the elbow and on the lower portion of the poppet face:
