Thermal analysis
In the 05 directory, run the analysis from the command line:
$ pan -b 05_thermal
After the analysis completes, the last few lines of the output file 05_thermal.out should be similar to the following:
Increment end
CPU wall for increment 4149 = 00:00:00.16, since start = 00:16:36.69
 inc = 4150 time = 500.00000 iter = 1 eps = 0.46419E+01
 inc = 4150 time = 500.00000 iter = 2 eps = 0.14182E+01
 inc = 4150 time = 500.00000 iter = 3 eps = 0.73320E-01
 inc = 4150 time = 500.00000 iter = 4 eps = 0.19888E-03
Finished writing file results\05_thermal_4150.case
Writing record: 84 , time: 500.000000000000
Increment end
CPU wall for increment 4150 = 00:00:00.13, since start = 00:16:36.83
Layer end
Finished writing file .\05 thermal.case

Analysis completed


************************
   1 Warning
************************

CPU wall = 00:16:37.23
CPU total = 01:05:42.89

Peak RAM used for this process = 72,468 kB

END Autodesk Netfabb Local Simulation

END Netfabb Simulation Solver
Mechanical analysis
In the 05 directory, run the analysis from the command line:
$ pan -b 05_mechanical
After the analysis completes, the last few lines of the output file 05_mechanical.out should be similar to the following:
CPU wall for increment 4284 = 00:00:00.27, since start = 00:34:13.42
 inc = 4285 time = 500.00000 iter = 1 eps = 0.70089E+05
 inc = 4285 time = 500.00000 iter = 2 eps = 0.42054E+05
 inc = 4285 time = 500.00000 iter = 3 eps = 0.49331E-09
Finished writing file results\05_mechanical_4285.case
Increment end
CPU wall for increment 4285 = 00:00:00.36, since start = 00:34:13.78
Layer end

------------------------------------------------------
 Total number of equilibrium iterations: 23916
Finished writing file .\05_mechanical.case

Analysis completed

****************************
   1 Warning
****************************

CPU wall = 00:34:14.20
CPU total = 02:08:13.17

Peak RAM used for this process = 129,260 kB

END Autodesk Netfabb Local Simulation
The results can be viewed in Simulation Utility for Netfabb or ParaView by importing the CASE files. Thermal results during deposition are shown at two different increments in Figure 3. Post-process distortion and a sample stress result is shown in Figure 4.
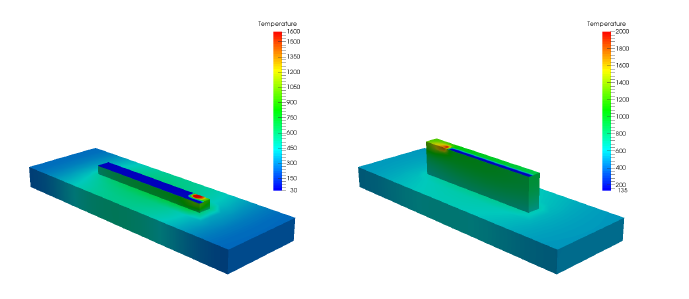
Figure 3: Temperature results (oC) at increments 1000 and 4000
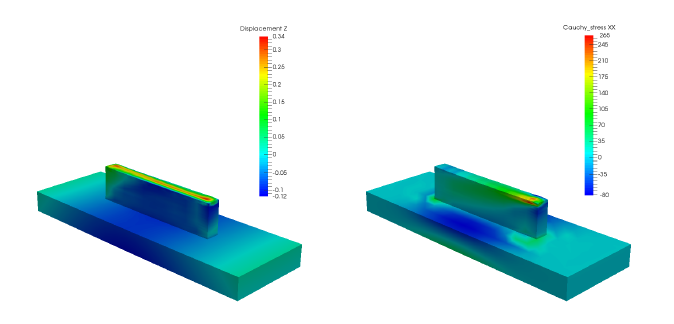
Figure 4: (a) Post-process distortion results, warped, (b) Post-process XX direction Cauchy stresses, warped 1X