After you run a systems analysis, you can review the results by reviewing the report or reviewing the results on the analytical model.
Review Reports
To view reports, open the Project Browser and scroll to Reports > Analysis Reports.
Revit automatically creates a time-stamped analysis report after each systems analysis is run. Reports are saved in a subfolder, called model name_Reports, in the folder where the model is saved. If you don't have access to the folder where the model is located, or if you've run the analysis on a new model that hasn't been saved, the report is saved in the My Documents folder.
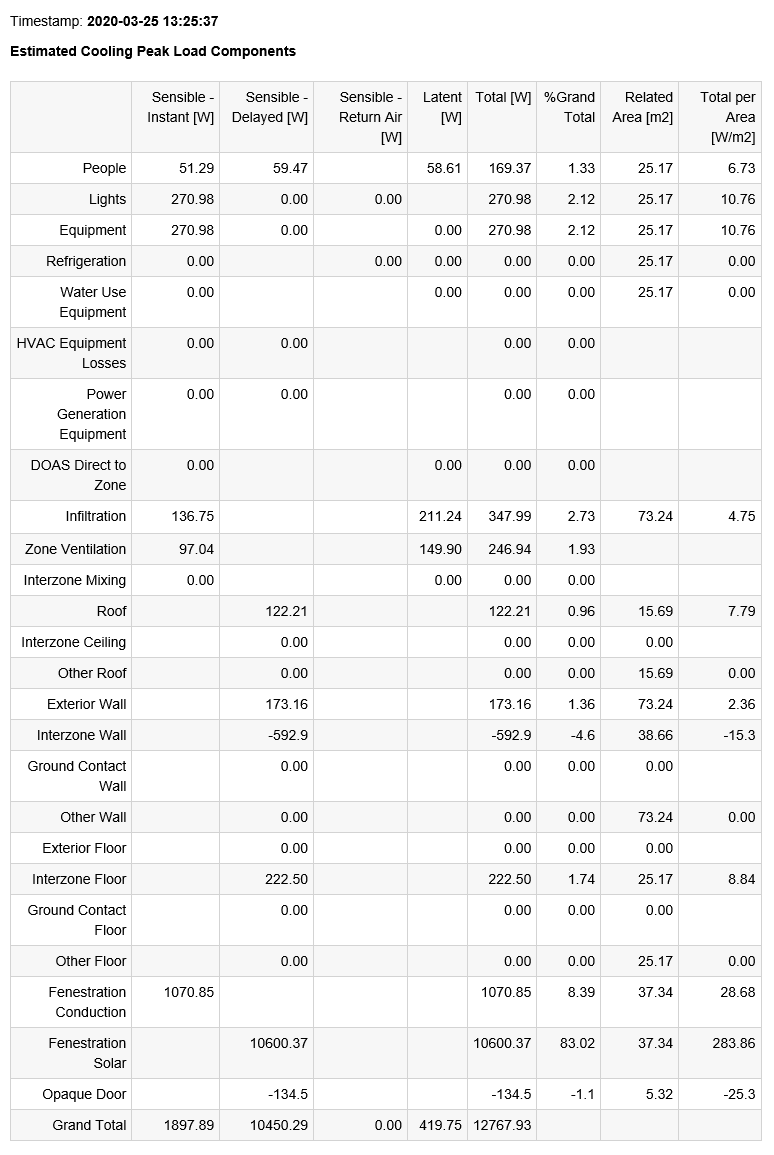
In the report, you can use the table of contents to find a specific section of the report. For example, the Zone Component Loads Summary contains heating and cooling sizing information for each analytical space. An example of a peak cooling load for a space is shown below. In this example, the total load is 12768W.
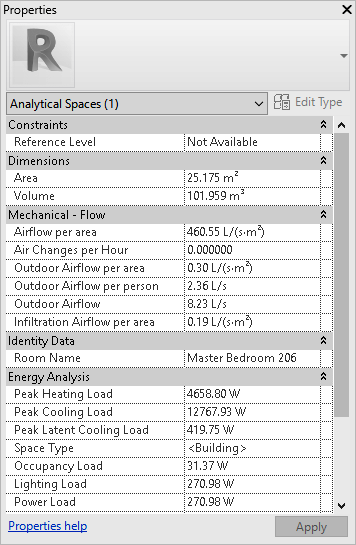
Review Results on the Analytical Model
In addition to the report which is generated after an analysis, the heating, cooling, and air flow peak demands are also set as properties on each analytical space. The following example shows the same cooling load as highlighted in the report section above.