Click
![]() or select Results > Global Analysis - Members to present variability of a selected parameter for all members of the currently designed structure.
or select Results > Global Analysis - Members to present variability of a selected parameter for all members of the currently designed structure.
Use this option to display the maximum and minimum values of a selected resultant quantity for each member element in one diagram. After selecting this option, choose a quantity to be presented. When indicated, the program creates a global diagram for the selected members.

The global diagram of selected parameters for all members is at the top of the dialog. This diagram is user modifiable. Right click the diagram and notice the line, column, member, 3D column, and 3D member Diagram Types.
The lower dialog contains a table with the following data listed.
- Column 1 - Parameters selected for presentation (internal forces, stresses, design parameters).
- Column 2 - Value of the upper limit. This is the value that allows one to determine the maximum value of the selected parameter and identify the members for which the maximum values have been exceeded.
- Column 3 - Value of the lower limit. This is the value that determines the minimum value of the selected parameter and identifies the members for which the minimum values have been exceeded.
- Column 4 - List of members for which the limit values of the selected parameters have been exceeded.
- Column 5 - List of members for which the values of the selected parameters fall within the range defined by the upper and lower limit values.
- Column 6 - Color selected for presentation of a given parameter.
- Column 7 and 8 - Respectively, the minimum and maximum value of the parameters selected for presentation. These are determined for all members in a structure.
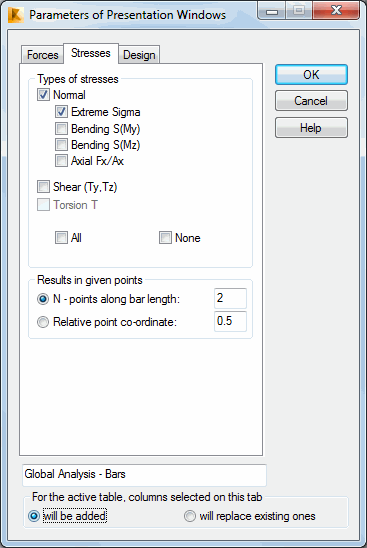
You can select the values to be presented in the table and in the diagram. Right click and select Table Columns to open the Parameters of Presentation Windows dialog. You can select the parameters to be presented within the global analysis of structure members in this dialog. It consists of the Forces, Stresses and Design tabs.

The value of the upper and lower limits for particular parameters can be defined in two ways.
- Textually, by introducing the values of upper or lower limit into the corresponding table cell.
- Graphically, having situated the mouse cursor in one of the table cells (upper or lower limit of the selected parameter), determine the limit value in the diagram field (a horizontal line represents the required limit value).