Use the Surface High/Low Points command to find the high and low points of a surface in relation to the surface watersheds.
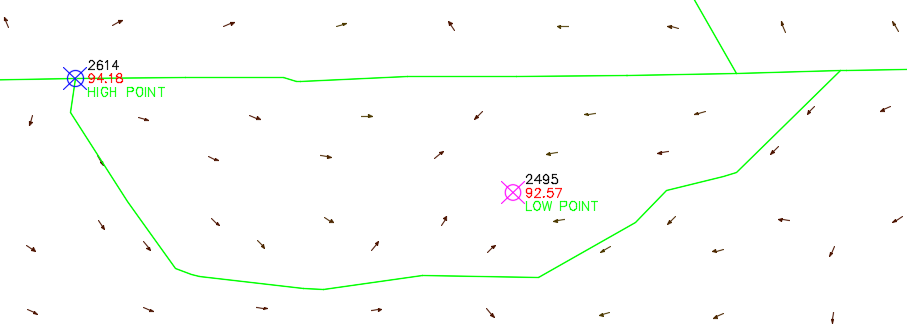
- The high points (from TIN data) are points that reside on or near a watershed edge and which are above the adjacent TIN node levels.
- The low points are the drain points on the surface. These low points correspond to watershed drain point locations.
The command creates COGO points at these locations. The points are placed in their own point groups, High Points - <surface name> and Low Points - <surface name>.
The following illustration shows an example of high and low points that are created for a depression watershed in a surface.

Tip: Use the Display tab in the Surface Style dialog box to turn on the visibility of watersheds and slope arrows in the surface style so you can see the relationship of the points that are created to the watersheds. You can also use the Watersheds tab in the Surface Style dialog box to turn on the display of watershed drain target points to see how the low points correspond to those.
Note: By default the high and low point groups are assigned the same point style.
- In the Toolspace, on the Toolbox tab, expand Miscellaneous Utilities
 Surfaces. Double-click Surface High/Low Points.
- In the drawing, select the surfaces you want to sample. Press Enter to end the selection.
- Optionally, select a closed polyline as a boundary to which to limit the area of the surface. To continue without specifying a boundary, press Enter.
- Optionally, set up and assign different point styles to each of the point groups that are created so you can more easily distinguish the high and low points.
Note: This command does not report the highest level within the boundary, nor the lowest level in the boundary.