A photometric web is a 3D representation of the light intensity distribution of a light source. This directional light distribution information is stored in a photometric data file in the IES format using the IES LM-63-1991 standard file format, or in the LTLI or CIBSE formats for photometric data. You can load photometric data files provided by various manufacturers as web parameters. In viewports, the light object changes to the shape of the photometric web you choose.
To describe the directional distribution of the light emitted by a source, 3ds Max approximates the source by a point light placed at its photometric center. With this approximation, the distribution is characterized as a function of the outgoing direction only. The luminous intensity of the source for a predetermined set of horizontal and vertical angles is provided, and 3ds Max computes the luminous intensity along an arbitrary direction by interpolation.
Web Diagrams
Photometric data is often depicted using a diagram. Diagrams that show rotation about an axis are known as goniometric.

Goniometric diagram of a web distribution
This type of diagram visually represents how the luminous intensity of a source varies with the vertical angle. However, the horizontal angle is fixed and, unless the distribution is axially symmetric, more than one goniometric diagram may be needed to describe the complete distribution.
In the 3ds Max user interface, web files are displayed as thumbnail diagrams.

Thumbnails of photometric web files
The bright red outline shows the beam. For some webs, a darker red outline shows the (less bright) field.
Photometric Web
The photometric web is a three-dimensional representation of the light distribution. It extends the goniometric diagram to three dimensions, so that the dependencies of the luminous intensity on both the vertical and horizontal angles can be examined simultaneously. The center of the photometric web represents the center of the light object.
The luminous intensity in any given direction is proportional to the distance between this web and the photometric center, measured along a line leaving the center in the specified direction.
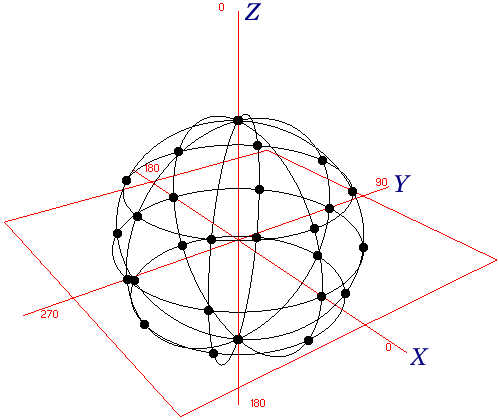
Example 1: Uniform Spherical Distribution

Example of uniform spherical distribution
A sphere centered around the origin is a representation of uniform spherical distribution, also known as isotropic distribution. All the points in the diagram are equidistant from the center and therefore light is emitted equally in all directions.
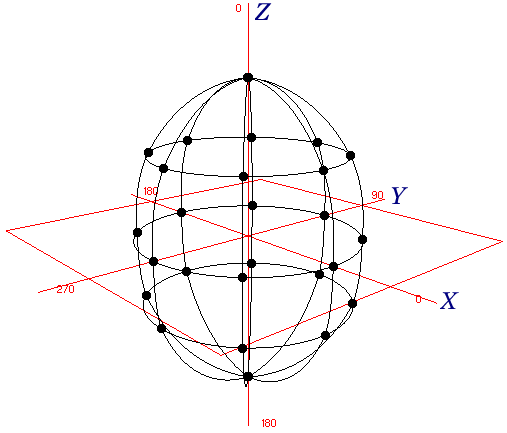
Example 2: Ellipsoidal Distribution

Example of ellipsoidal distribution
In this example, the points in the negative Z direction are the same distance from the origin as the corresponding points in the positive Z direction, so the same amount of light shines upward and downward. No point has a very large X or Y component, either positive or negative, so less light is cast laterally from the light source.