Display rollout
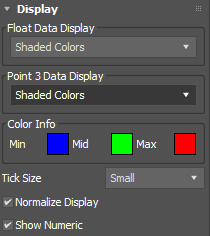
Use the Display rollout to customize how data is displayed in the viewports.
- Float Data Display
- Displays float data as either tick marks or shaded colors.
- Point 3 Data Display
- Displays point 3 data (vectors) as either position ticks, color ticks, vectors, or shaded colors.
- Color Info
- Sets the color display to visualize minimum to maximum values of data. Click a color swatch to change the associated color.
Tip: If you set Min and Max to black, and Mid to white, you can visualize the data of an object's contours in grayscale.
- Tick Size
- Changes the tick mark size to either small, medium or large.
- Normalize Display
- Applies a normalize operation to smooth out displayed data.
- Show Numeric
- Shows the actual numeric data, overriding all other visualizations.
Parameters rollout
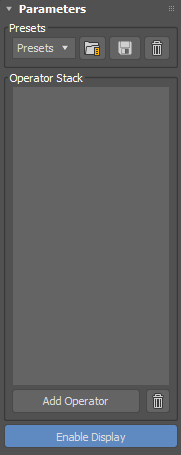
Use the Parameters rollout to add operators, save and load presets, and enable the visual display of data in the viewports.
- Presets
- From the drop-down menu, choose from the list of preset operator stacks.
- Click
 to load a selected preset.
- Click
 to save the current stack as a preset. When saving a preset, you specify a name and an optional tooltip to show while hovering over the name in the list.
- Click
 to delete the selected preset.
The presets are stored in 3ds Max 2017\en-US\plugcfg\DataChannelPresets.
- Click
- Operator Stack
- Shows the currently-added operators in the process stack. Drag and drop operators to reorder them. Right-click operators to open the context menu.
- Add Operator
- Click to open the Add Operator dialog.
- Enable Display
- Click to enable the visual display of data in the viewport.
Add Operator dialog
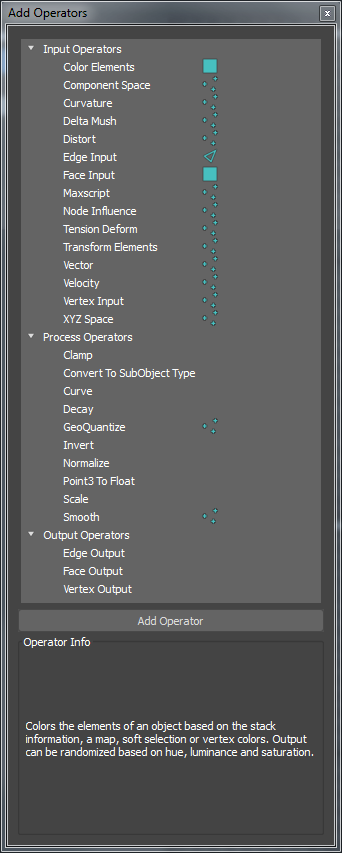
Use the Add Operators dialog to add input, process, and output operators to the stack.
- Operator List
- Shows a list of available operators and their channel type, either edge, face, or vertex.
- Add Operator button
- Adds operators to the process stack. You can also drag and drop operators from the list to a desired position in the stack.
- Operator Info
- Shows a brief description of the currently selected operator.
Context menu
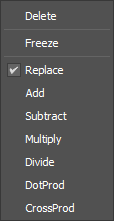
Right-clicking an operator displays the context menu, when available. Use this menu to freeze operators and change blending mode.
- Delete
- Deletes the selected operator.
- Freeze
- Freezes the operator so values do not update, capturing the state of the input at the frame at which frozen. Frozen operators are shown in blue in the stack.
- Replace

- Replaces existing values with new values.
- Add

- Adds values to existing values.
- Subtract

- Subtracts values from existing values.
- Multiply

- Multiplies values with existing values.
- Divide

- Divides values with existing values.
- DotProd

- Provides a float value based on the dot product between the existing and input vectors.
- CrossProd

- Provides a vector based on the cross product between the existing and input vectors.
Curve Editor
| Operator: | Parameters: |
| Decay | Custom Decay Curve |
| Curve | Curve Control |
| Node Influence | Falloff Shape, Strength Over Time, Radius Over Time |
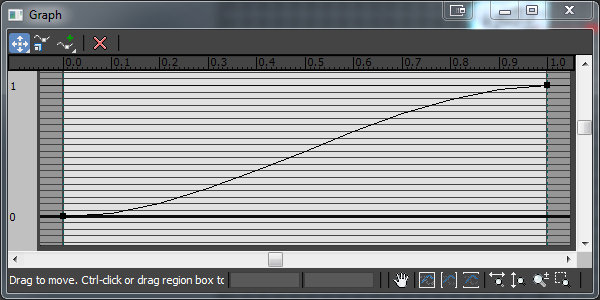
Main toolbar
- Move icons
- Enable to move control points on the curve.
-
 Move XY to move control points freely. You can also right-click a point and choose
.
Move XY to move control points freely. You can also right-click a point and choose
.
-
 Move X to move control points horizontally only. You can also right-click a point and choose
.
Move X to move control points horizontally only. You can also right-click a point and choose
.
-
 Move Y to move control points vertically only. You can also right-click a point and choose
.
Move Y to move control points vertically only. You can also right-click a point and choose
.
From the drop-down menu, choose one of the following:
-
- Scale icon

- Enable to scale selected control points up and down.
- Add Point icons
- Enable to add points to the curve.
-
 Add Corner Point
to add fixed control points.
Add Corner Point
to add fixed control points.
-
 Add Bezier Point
to add control points with adjustable tangent handles.
Add Bezier Point
to add control points with adjustable tangent handles.
From the drop-down menu, choose one of the following:
You can also right-click a point and choose Corner (no tangent handles), Bezier-Smooth (tangent handles move together), or Bezier-Corner (tangent handles move independently) to change the interpolation mode.
-
- Delete Point icon

- Enable to delete control points from the curve.
Navigation toolbar
Use these icons to pan and zoom in the editor window.
- Pan icon

- Enable and drag to pan the view.
- Zoom Extents icon

- Fits all control points in the edit window.
- Zoom Horizontal Extents icon

- Fits all control points horizontally in the window.
- Zoom Vertical Extents icon

- Fits all control points vertically in the window.
- Zoom Horizontally icon

- Enable and drag to zoom horizontally.
- Zoom Vertically icon

- Enable and drag to zoom vertically.
- Zoom icon

- Enable and drag to zoom in and out.
- Zoom Region icon

- Enable and drag to zoom into a specific region.