Measure the deviation between two objects
![]()
How to use the tools in the Locators > Deviation sub-palette to show comb plots measuring the deviation between objects.
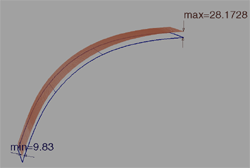
Measure the exact deviation between two curves at a single location
-
In the Locators tool palette, select the Deviation > Deviation tool
 .
. -
Click the first curve on the point from which you want to measure.
Note:Curve selection order can make a difference in the curve-to-curve deviation results.
-
Click the second curve.
A measurement appears indicating the distance between the selected point on the first curve and the closest point on the second curve.
Note:The curves can be either free curves, surface edges, trim edges, isoparametric curves, or curves-on-surface.
-
Do one of the following:
- Drag the arrowhead to move the measurement along the first curve. The measurement updates to show the distance between the new point on the first curve and the closest point on the second curve.
- Drag the label to move it.
Add a deviation comb plot between two objects
-
Choose the appropriate tool from the Locators tool palette for the object types you want to compare:
-
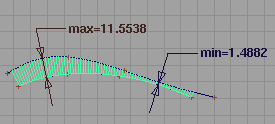
To compare a curve to a curve, choose the Deviation > Curve to Curve tool
 .
. Tip:
Tip:After adding the locator you can use Shift +
 click anywhere along the length of a curve to add another measurement point. Shift + a measurement point to remove it.
-
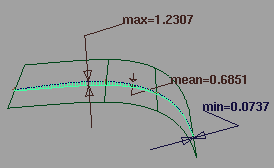
To compare a surface to a surface, choose the Deviation > Surface to Surface tool
 .
. 
-
To compare a curve to a surface, choose the Deviation > Curve to Surface tool
 .
.
-
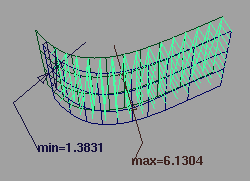
To compare a mesh to a surface, choose the Deviation > Mesh to Surface tool
 .
.
-
To compare a surface to a cloud, choose the Deviation > Cloud to Surface tool
 .
. -
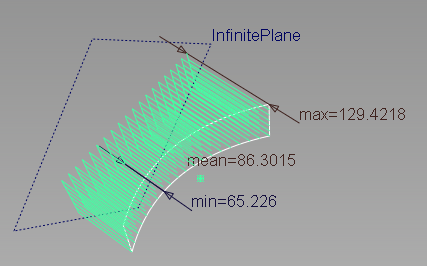
To compare a construction plane to a curve, surface or mesh, choose the Deviation > Object to Plane tool
 .
.
-
-
Select the two objects. You must select the objects in the order specified by the tool name. For example, in Curve to Surface deviation, select a curve, followed by a surface. (For Object to Plane, the order does not matter.)
Tip:Remember that for “curves” you can use surface edges, trim edges, isoparametric curves, and curves-on-surface in addition to free curves. For all tools, you can also select objects in reference layers. The tool displays a deviation comb indicating the deviation across the length of the objects, labeling the minimum, maximum, and mean. The Mesh to Surface deviation tool only displays the minimum and maximum deviations.
-
Do any of the following:
- Drag the to change the scale of the quills.
- Drag the
 to change the density of the quills.
 - Drag a label to move it.
- For Curve to Curve deviation, drag the Start and End manipulators to specify a range for the comb start and end points. You can also enter Start and End values under Modify Range.
- Drag the
View the exact numeric values from a deviation locator
Choose Windows > Information > Deviation Table.
-
Press on a row in the deviation table to highlight the corresponding position on the model with a red arrow.
-
To check for values within a certain range, set the Gap Band Min and Gap Band Max options. Values within this range are highlighted in the deviation table window.
-
To show only the values within this range, click Clip to Band.
-
To reset the range to the defaults, click Reset Band.
-
To save the information in a file, click Save. You can then import the data into, for example, a spreadsheet program for analysis.
Tip:The deviation table updates as you change the model.