Animation > Editors > Animation Stats
Displays the number of animation-related attributes for selected DAG nodes.

These attributes are included in the window’s columns:
Object Names
DAG node name. Edit it by double-clicking on the field.
Clusters
Number of clusters affecting the node or geometry below the node.
Constraints
Number of constraints affecting the node.
Channels
Number of node attributes that are animated.
For example, if only the node’s rotations are animated, channels would be 3 (X, Y, and Z).
Min Frame
Earliest keyframe, if there is any keyframed animation. If there isn’t, the value is 0.
Max Frame
Latest keyframe, if there is any keyframed animation. If there isn’t, the value is 0.
Param Curves
Number of parameter curves that are directly animating this node. Note that instanced curves are only counted once.
For example, if translate, rotate, and scale were animated, and a new timewarp created, Param Curves would be 10 curves (we don’t count the timewarp for every channel)
Expressions
Number of expressions that directly animate the node.
Keyframes
Total number of keyframes in the curves that animate this node.
As with Param Curves, keyframes on instanced curves are only counted once.
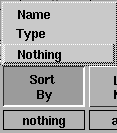
Sort By menu

Nothing
Shows the nodes in DAG order, with the DAG type icon.
Type
Sorts the nodes by type, with the DAG type icon.
Name
Sorts by name (doesn’t show the DAG type icon).
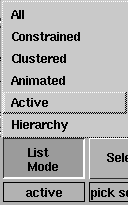
List Mode menu

All
Shows all nodes in the system.
Constrained
Show all constrained nodes.
Clustered
Shows all nodes that are directly clustered; that is, the node that you see as a cluster member in the cluster editor.
Animated
Shows all animated nodes.
Active
Shows active nodes.
Hierarchy
Shows active nodes and all nodes below them.
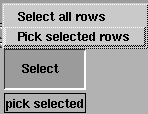
Select menu

Select all rows
Highlights all rows in the window
Pick selected rows
Does a model-pick on the nodes in the selected rows. If nodes on the same branch are highlighted, the highest node is picked.