Alias Theory Builder
Visual Evaluation of 'Lines' – Curves, Edges and Isoparms
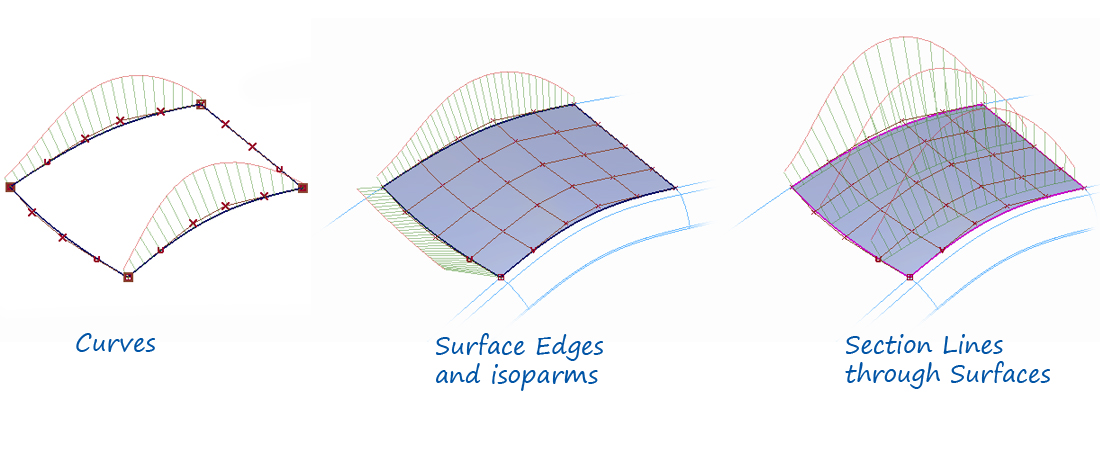
We evaluate the visual quality of a line using a curvature 'comb' plot (shown in green below). This can be applied to curves, surface edges and isoparms, and to section lines through a surface.
Interpretation of Curvature Combs
Curvature Comb Calculation
The 'Curvature' is calculated as the Inverse of the Radius at any one point. This calculation is displayed graphically at discreet points along the curve, and it's the way in which these curvature 'combs' change along the curve – the flow – that informs us about the shape:

- The length of each curvature line is proportional to the inverse of the radius of the curve at that point.
- The direction of each curvature line is at 90 degrees (normal) to the curve at each point.
- The red outline shows the smoothness and character of the curve.
Understanding the 'Flow' of the Curvature Comb
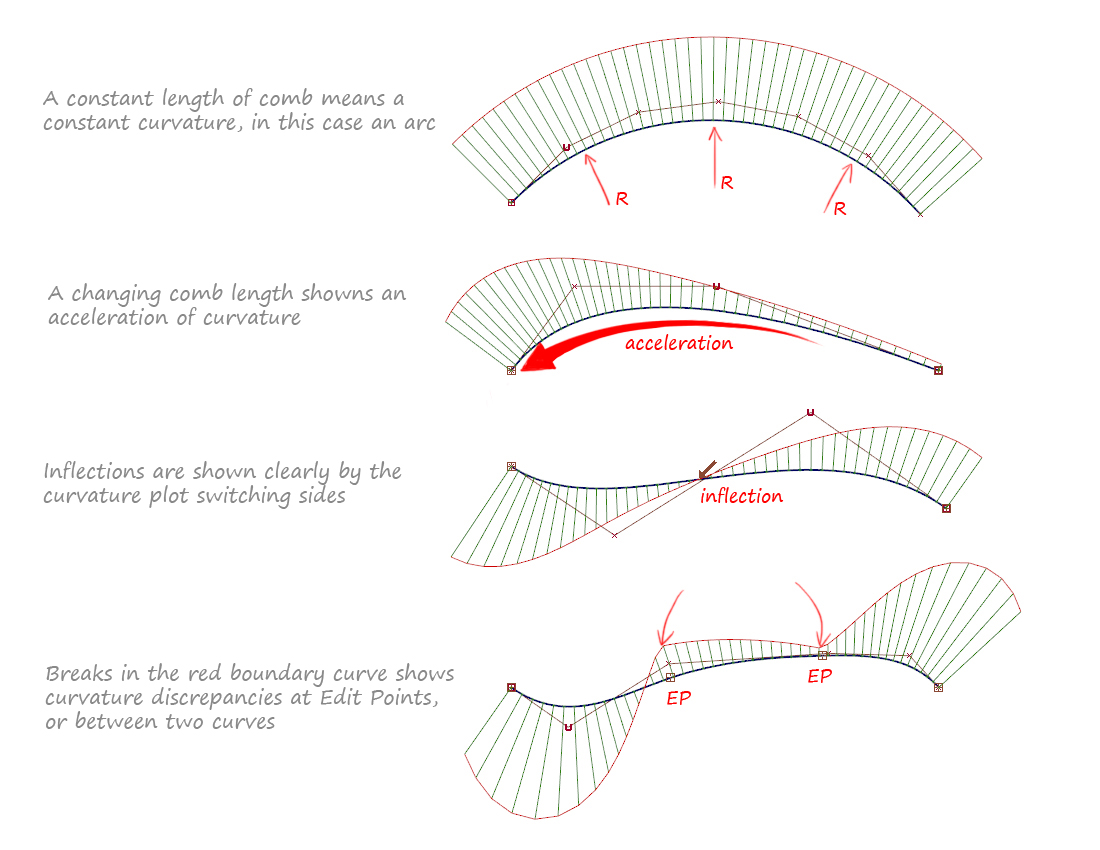
The comb plot can give you valuable information on the look and 'feel' of your curve or surface, and with experience you will learn to interpret the comb plot and understand how it relates to the real-life surface.
Here are some typical interpretations:
Evaluating Continuity Between Curves
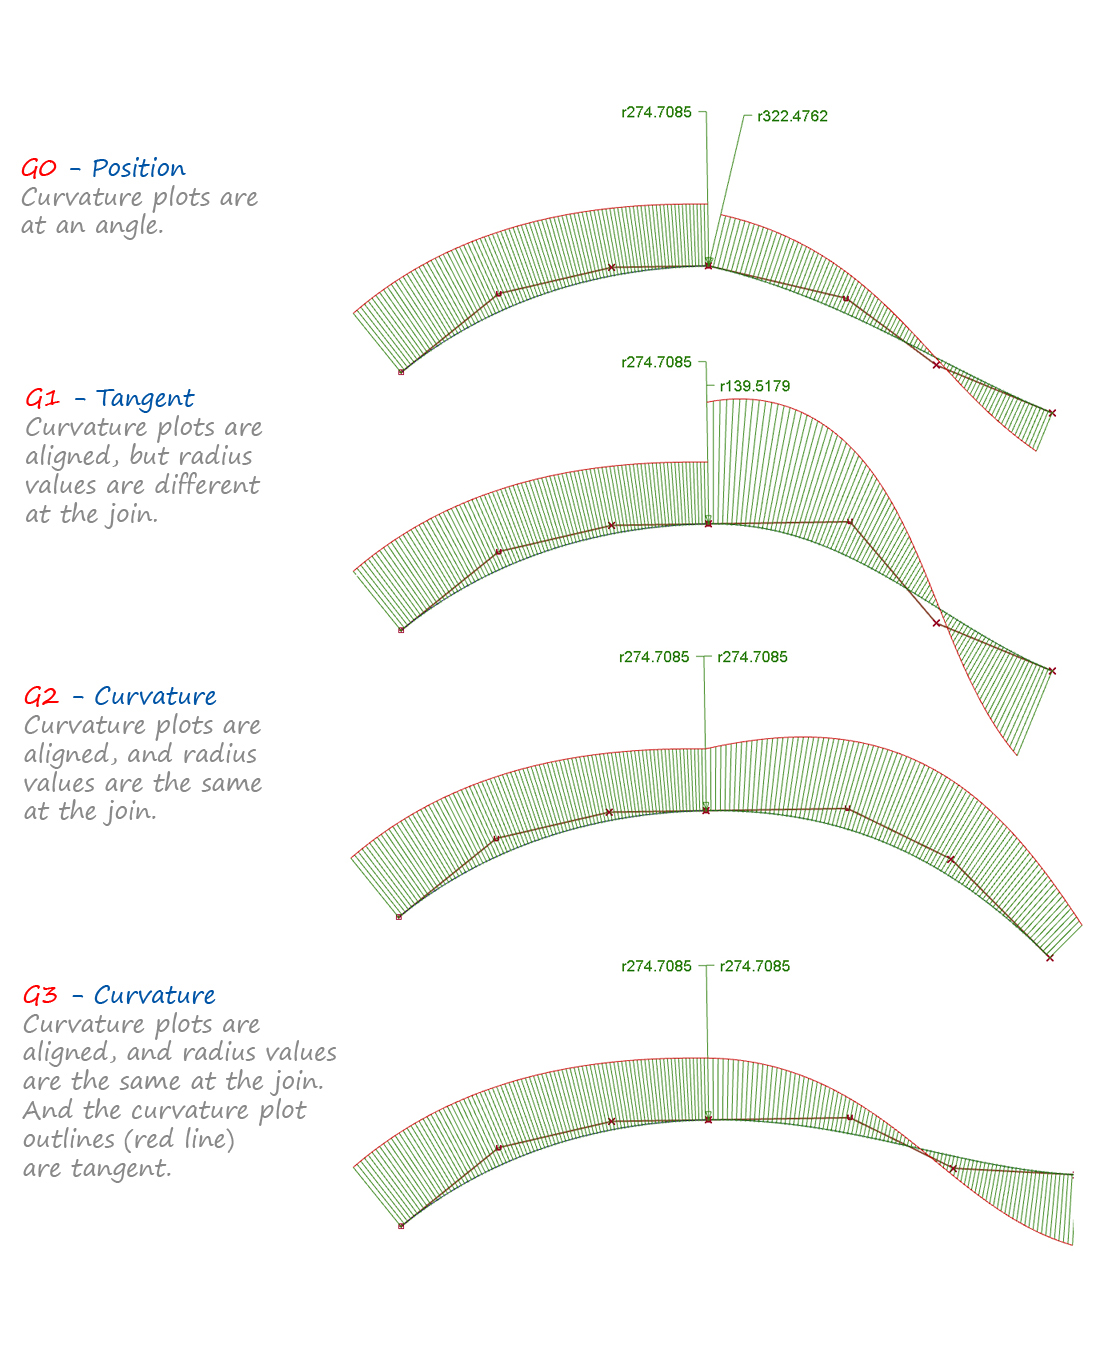
So far we've just looked at applying the comb plot to a single curve or isoparm. But comb plots are key to accurately understanding how two curves or surfaces join – their 'continuity'.
The four continuity levels, G1, G1, G2 and G3 are explained in detail in the Continuity 1: G0, G1, G2, G3 Theory Builder.
This is how the comb plots between two curves are shown for each continuity level:
Tools to Create Curvature Combs
Locators > Curve Curvature
Apply the Curve Curvature tool by clicking on a curve or surface isoparm. At this time (while the locator is active) you can adjust the comb plot interactively using the mouse buttons.
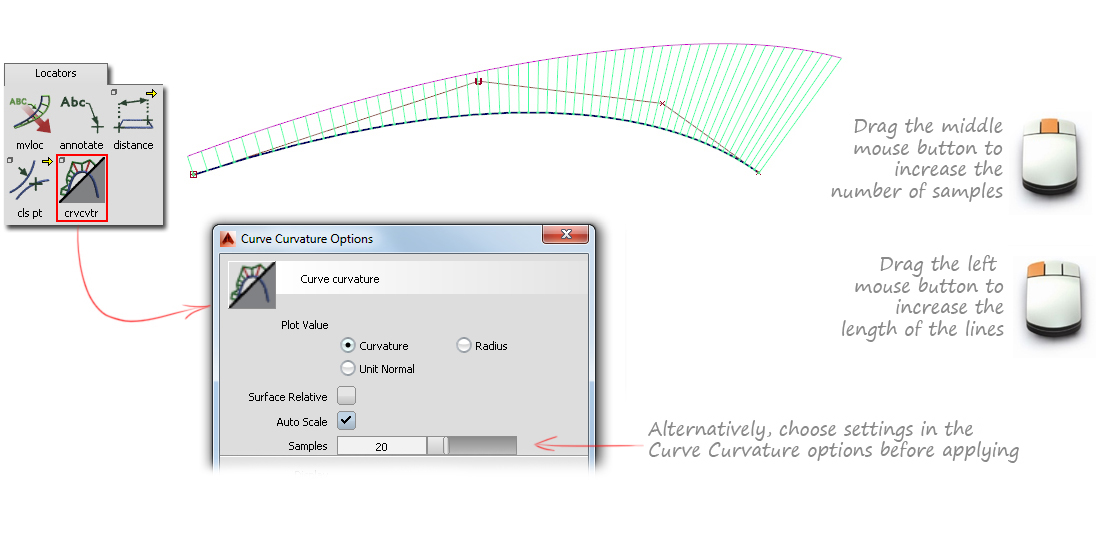
To go back to an existing comb plot to change the settings:
- Use Pick > Locator if it's not already active.
- Use Windows > Information > Information Window to change the settings.
- Use Delete > Locators to remove.
Curvature Comb on Cross-Sections
Curvature comb plots can be applied along cross-sections using one of:
- Windows > Cross-Section Editor.
- The xsedit icon on the Control Panel.
This has the advantage that it is independent of the surface orientation and isoparm direction, so gives an accurate comparison across different surfaces.
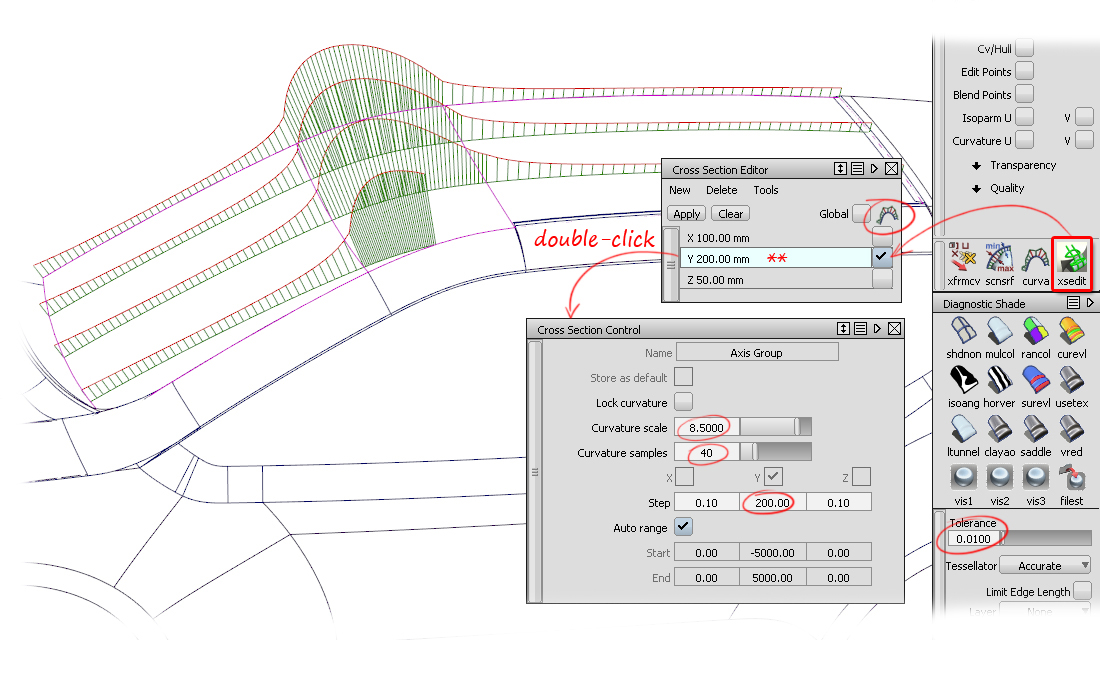
It's important to note that these comb plots are applied to the tessellated surface, and so the accuracy is controlled by the Diagnostic Shading tolerance setting.
For more information on creating different types of cross-section, see the What's New in Alias 2011 Videos – Cross Section Editor movie.
Curvature Comb on Isoparms
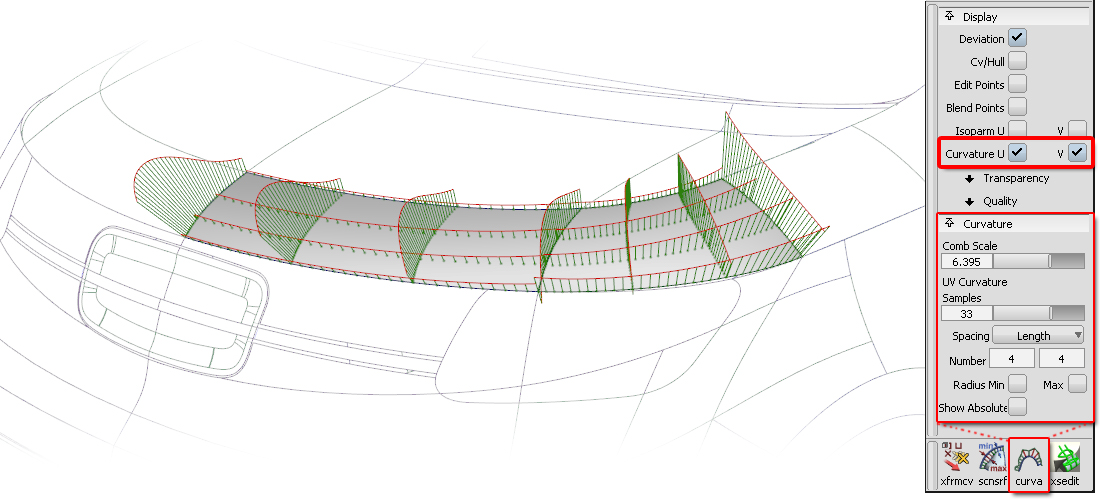
A curvature comb plot can be applied along the isoparm directions of a surface using the Control Panel tools:
- Control Panel > Display > Curvature U/V (Displays curvature on the edges and isoparms of a surface).
- Control Panel > Curvature Controls the display of the comb plot – (size and spacing).
