In this exercise, you use the Palette Manager to prepare a contour map from a map image that contains many other details.
| To extract contours from a detailed map | ||
|---|---|---|
| 1 |
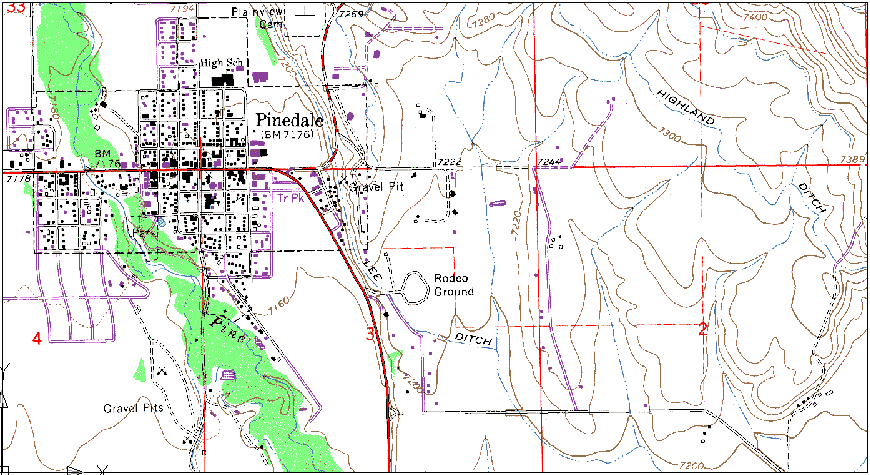
Open the LiveView_Palette.dwg sample file. A map of Pinedale is displayed, showing roads, rivers, buildings, and other details. |
 |
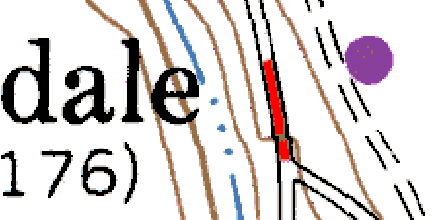
| 2 | Zoom in to the map so you can clearly pick the color of the contour lines. |
 |
| 3 |
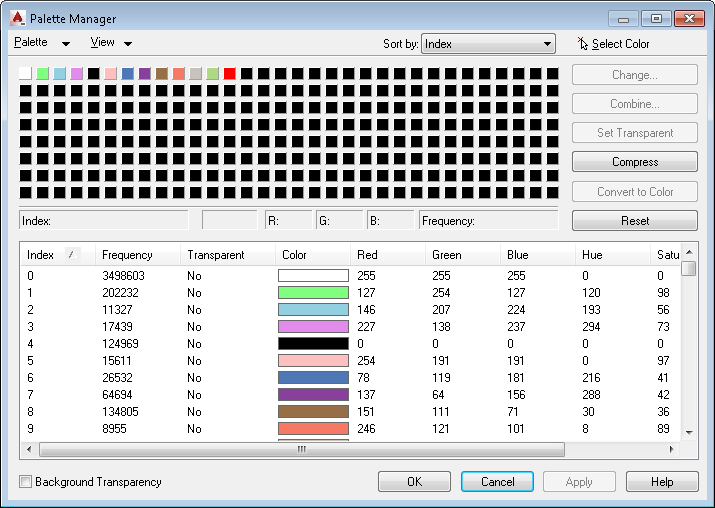
Click Raster Tools The Palette Manager dialog box displays the color palette for the map. |
 |
| 4 |
Click Select Color, then click one of the contour lines in the drawing. The brown color (index 8) is highlighted in the Palette Manager, showing numeric values. |
 |
| 5 |
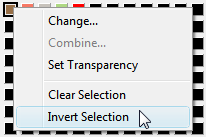
Right-click the selected color square on the top row of the Palette Manager. Click Invert Selection. All colors except brown are selected. To isolate the contour lines, you can turn all the selected colors to white. |
 |
| 6 |
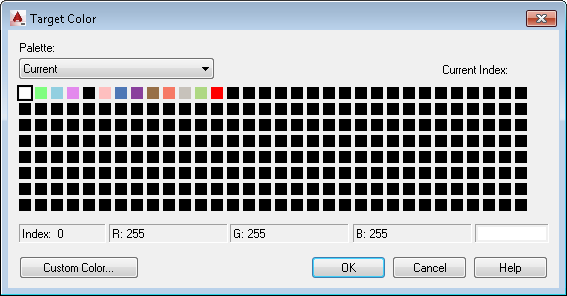
Click Combine. In the Target Color dialog box, click the white square, then click OK.
Note: The change in the Frequency column of the table: all colors except indices 0 and 8 now have a frequency of 0.
Note
|
 |
| 7 |
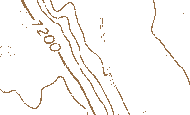
Click OK. The change is applied to the drawing. The resulting image could be used to prepare a contour map of the region. |
 |
