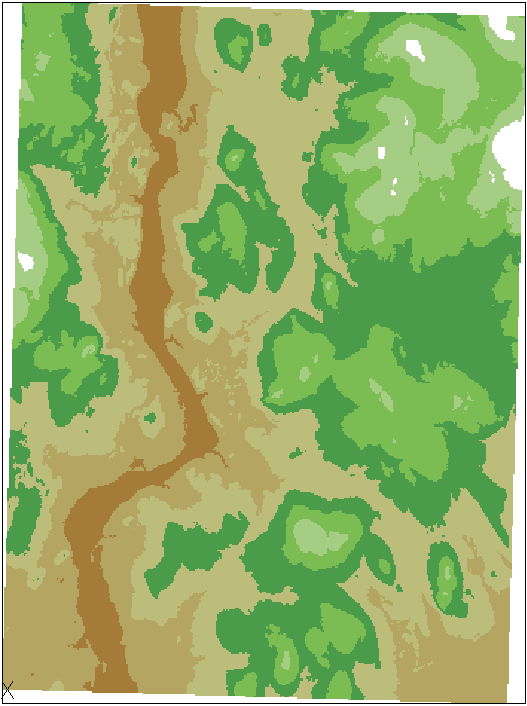
In this exercise, you see how different palette color maps assist the visual analysis of a DEM.
| To edit a palette color map | ||
|---|---|---|
| 1 |
Open the LiveView_ColorMap.dwg sample file. A terrain map is displayed that shows several different colors. In the next few steps you will see the color map that shows how to interpret these colors. |
 ¶ |
| 2 |
If the
Image Manager toolspace is not open, click
Raster menu |
 |
| 3 |
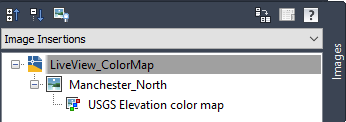
In the Image Insertions view, right-click the image name and click Edit Color Map. |
 |
| 4 |
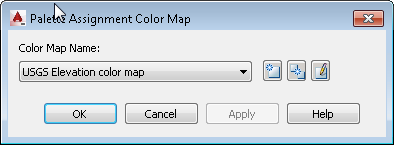
In the
Palette Assignment Color Map dialog box, click
|
 |
| 5 |
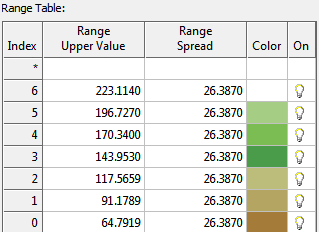
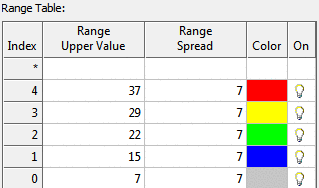
In the Palette Color Map Definition dialog box, in the Range Table, note that each color on the map represents an elevation range of 86.57 m. Click OK to close the dialog box. |
 |
| 6 |
In the Palette Assignment Color Map dialog box, select the Slope color map, then click Apply. The colors on the map now show ranges of ground slope values. |
 |
| 7 | Click
Further exploration: In the Palette Color Map Definition dialog box for a color map, change the Value Distribution from Equal to Quantile, click OK, then click Apply. |
 |
