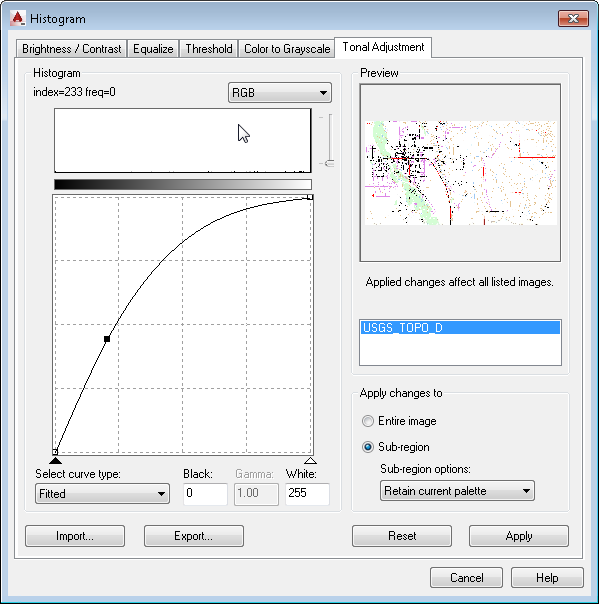
The Histogram dialog box provides a set of multi-purpose editing filters you can use to permanently change the appearance of grayscale and color images. A histogram is a bar graph that represents the number of pixels per pixel shade in a selected image or images. Dark pixels are shown on the left, grays or mid-tones are in the middle, and lighter shades are on the right. The number of pixels per pixel shade is represented by the height of the corresponding bar.
When you use the Histogram (iHistogram) command on an image, the Histogram dialog box displays a histogram and a preview of the image.

Some of the ways you can use the Histogram dialog box to modify an image are as follows:
- Adjust the brightness and contrast of one or more images using the Brightness/Contrast tab.
- Maximize the image detail using the Equalize tab.
- Convert grayscale and color images to bitonal images using the Threshold tab.
- Convert color images to grayscale using the Color To Grayscale tab.
- Adjust the contrast in a non-linear fashion using the Tonal Adjustment tab.
The Image Adjust color map (or AutoCAD IMAGEADJUST command) makes display-only adjustments, but the edits you make to an image using the Histogram command are permanent and saved with the image.
You can limit the effect of brightness, contrast, equalizing, or tonal adjustments to a portion of the image called a subregion. You can define a subregion using one of four methods:
- Use an existing closed vector entity to define the region.
- Use an existing image clip.
- Define a rectangular subregion by clicking two points.
- Define a polygonal subregion by clicking several points.
Other points to note:
- The histogram adjustments affect all images that are currently selected, not only the image displayed in the preview. You can preview how the histogram adjustments will affect an image in the selection set by clicking its name in the list of images.
- For color images, you can modify all channels (Red, Green, and Blue) together or separately.
- If you make changes to the display of the image using the Image Adjust color map or AutoCAD IMAGEADJUST command, then the image saved to disk is displayed in the Histogram Preview area. If you make changes to the image with the iHistogram command, then the Image Adjust controls are reset.