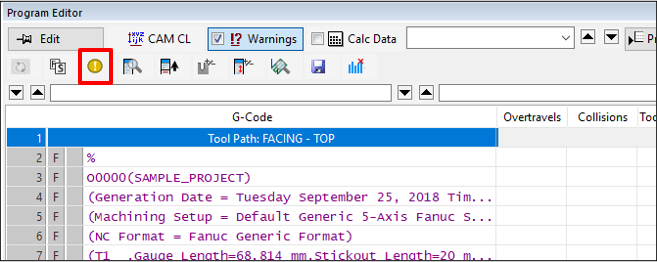
Program Editor
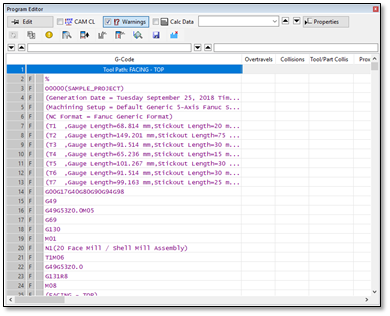
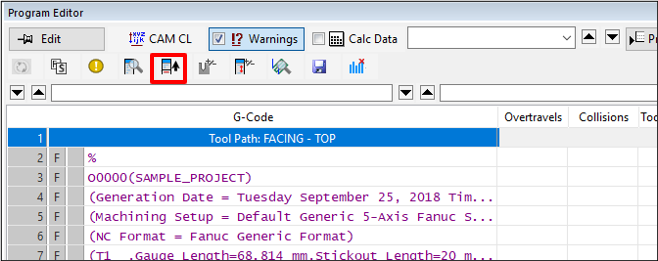
The Program Editor view allows you to navigate and modify your NC Programs.
By default, the Program Editor view is docked to the right side of the application. The main grid shows the G-Code and the bottom window shows the Command Line Properties of the currently selected line.
The buttons are:
|
|
Edit – Enable and disable the Edit mode |
|
|
CAM CL – Hide or show the CAM CL data (XYZ, IJK and the Feed columns) |
|
|
Warnings – Hide or show the warnings columns |
|
|
Calc Data – Hide or show the calculated data columns |
|
|
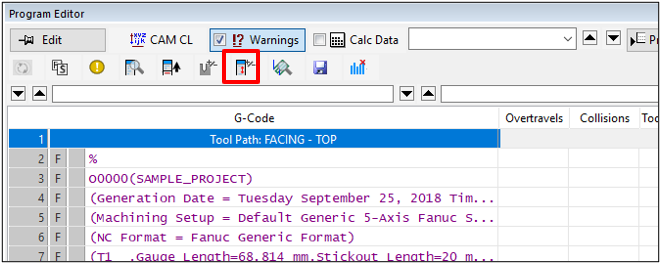
Find – Find a code or G-Code text |
|
|
Properties – Toggle the command line properties view |
|
|
Regen – Regenerate the programs (if they have been edited) |
|
|
Codes – Show the Codes navigator window |
|
|
Errors – Show the Errors navigator window |
|
|
Grid Properties – Set the grid properties (control the columns and their order) |
|
|
Summary – Hide or show the summary row at the bottom of the editor |
|
|
Cyc Steps – Show the canned cycle steps in the editor |
|
|
Show Hidden Lines – Show lines that don’t have G-Code. |
|
|
Interpolated Points – Show the interpolated point navigator |
|
|
Export GCode – Export the program(s) as G-Code |
|
|
Reset Volume Data – Reset the calculated volumetric removal data for the tool positions (used for volumetric removal rate optimization) |


Controlling the Output Columns
-
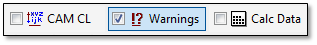
The output columns are controlled by the CAM CL, Warnings and Calc Data buttons:
-
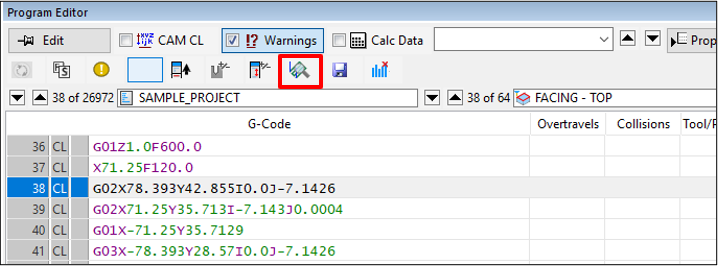
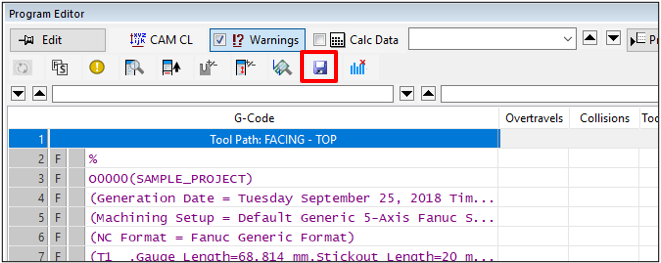
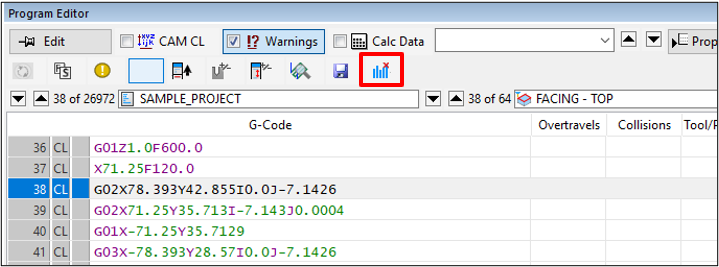
Enabling the CAM CL button will show the CAM data and the NC Format command code columns to the left of the G-Code:
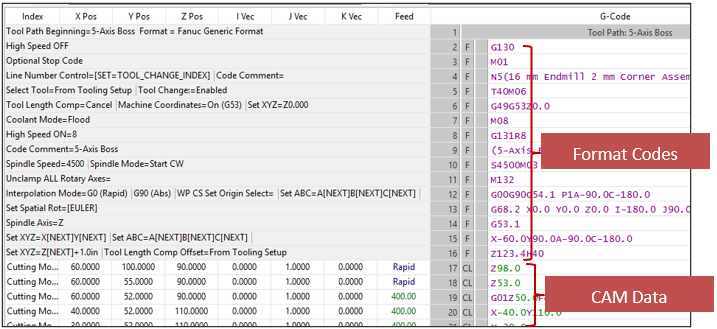 Note: When the CAM CL option is turned OFF, the G-Code column is drawn with either an F tag (for Format code lines from the NC Format) or a CL tag (for tool position lines from the CAM system).
 -
Enabling the Warnings button will show the Warnings columns for Collisions, Overcuts, Proximity alerts and Overtravels:
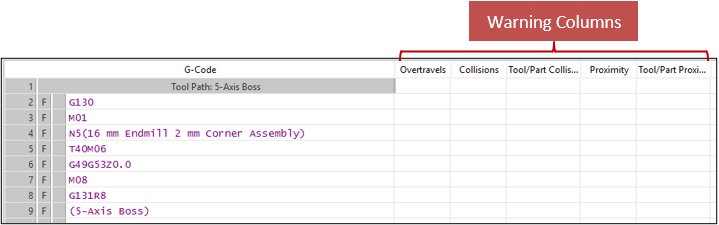
-
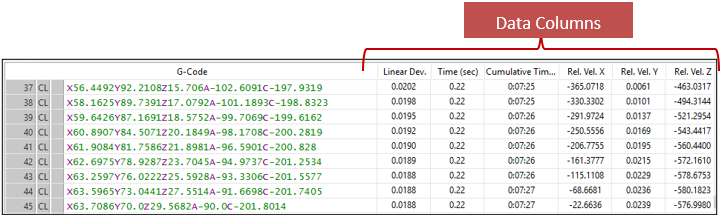
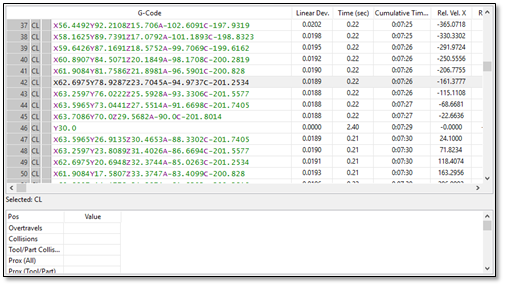
Enabling the Calc Data button will show the calculated data for the tool path:
Search Window
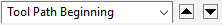
The search window drop list allows you to search through the G-Code for codes of a certain type. You can also search for specific G-Code
-
Click the drop list and find the type of code that you want to search for. For example, to search coolant codes, switch it to Change Coolant:
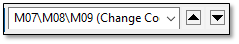
-
Clicking the Find Next and Find Previous arrow buttons (on the right of the drop list) will look forwards and backwards looking for coolant codes. Note that in this mode, ANY coolant codes will be found, regardless of whether it’s a coolant flood, coolant through, off etc.
-
To search for a specific line of G-Code, type it directly in the drop list. For example, to search for X2.0 type it into the drop list:
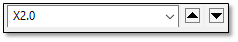
-
Then using the Find Next and Find Previous to search through for the G-Code that matches that (exact matches only)
The Command Line Properties window
-
Click
 to hide or show the Command Line Properties window.
 -
This window will appear at the bottom of the editor.
-
Selecting a cutter location line will show the values for that location:
-
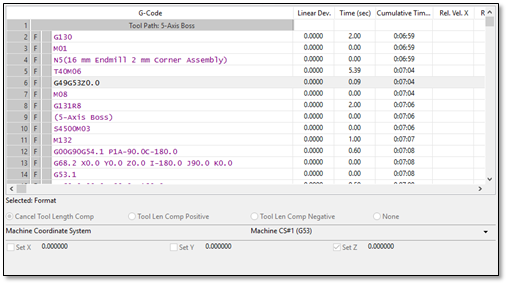
Selecting a formatted line will show the codes for that line:
-
When you activate the Edit mode you can edit the codes or the tool position values.
-
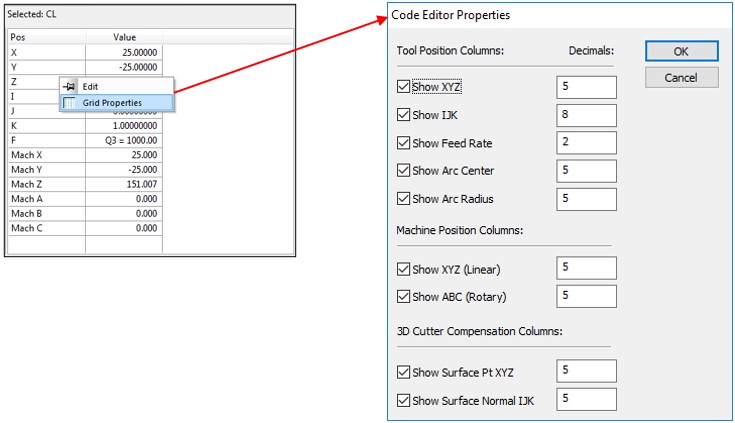
If you have a tool position selected, you can right-click the Cutter Location grid and select Grid Properties:
-
This will display the Code Editor Properties.
-
This dialog allows you to control the display of the various items in the grid and how many decimal places are shown for each item.
Show XYZ – Shows the XYZ position values of the tool position.
Show IJK – Shows the IJK orientation vector values of the tool position.
Show Feed Rate – Shows the feed rate value of the tool position.
Show Arc Center – Shows the XYZ arc center values of an arc tool position (not shown for non-arc tool position types).
Show Arc Radius – Shows the arc radius value of an arc tool position (not shown for non-arc tool position types).
Machine Position Show XYZ (Linear) – Shows the machine position of the XYZ linear axes.
Machine Position Show ABC (Rotary) – Shows the machine position of the ABC rotary axes.
3D Cutter Compensation Show Surface Pt XYZ – Shows the current surface point XYZ location (must be supported by your CAM system).
3D Cutter Compensation Show Surface Normal IJK – Shows the current surface normal vector IJK (must be supported by your CAM system).
-
Modify the properties as needed and clickOK. The Grid rows will be changed accordingly.
Accessing the Command Line Properties with Double-Click
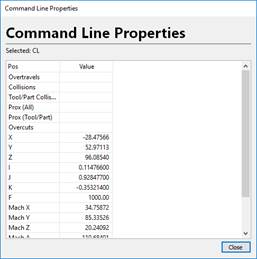
As an alternative to having the Command Line Properties window open, you can double click any line in the editor.
-
Select the line you want to edit.
-
Double-click it with the left muse button.
-
The Command Line Properties dialog will be displayed as a floating dialog. This window works exactly the same as the window that appears in the Program Editor.
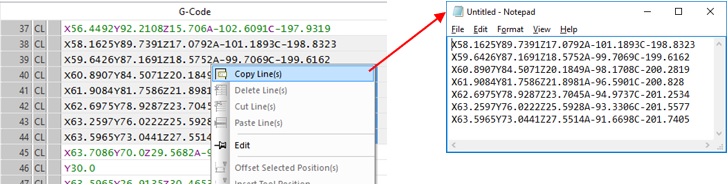
Copying G-Code to the Windows Clipboard
-
Select the lines that you want to copy in the editor.
-
Right-click and select Copy Lines from the context menu.
-
The G-Code from the selected lines will now be in your Windows Clipboard.
-
You can now paste it into another application such as an email client or a text editor:
Regen
The Regen button will be active when there is G-Code that requires reposting:
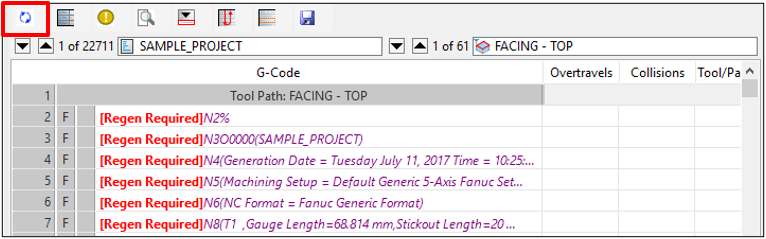
Clicking this will repost any programs that require it.
Codes Navigator
The Codes button will launch the Code Navigator view:
The Code Navigator view shows all of the import codes in each program including tool numbers (T, H and D codes), spindle speeds, feed rates, path tolerances, macro codes and coolant codes:
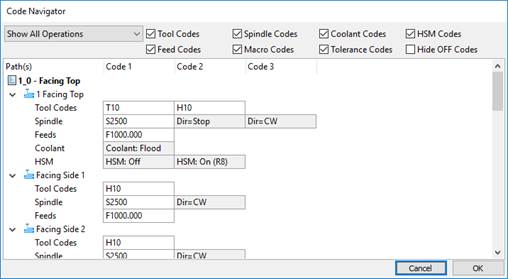
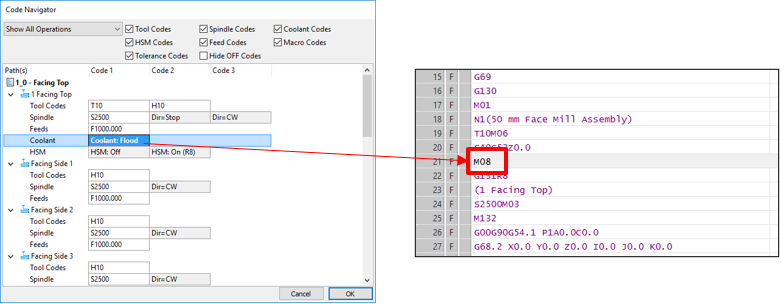
The check boxes on top filter which codes are shown. The drop list lets you select whether the navigator shows ALL programs or only the programs that are currently shown in the editor. Edit any code by double clicking it in the grid. When you select a code, the simulation will move to that code in the editor:
Error Navigator
The Errors button will launch the Error Navigator view:
The Error Navigator view shows the error status of each program and path. (see The Error Summary View).
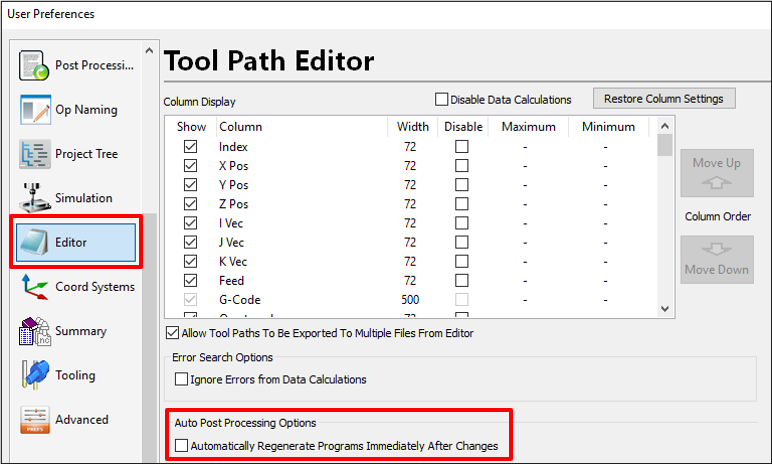
Grid Properties
The Grid Props button will launch the Tool Path Data Grid Properties view:

The Tool Path Data Grid Properties view shows the settings for each column in the main tool path editor grid:
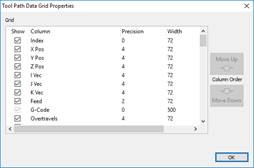
Show – Controls whether the column will be displayed or not.
Column – The name of the column (not editable).
Precision – The number of decimal places for data types.
Width – The size of the column in pixels.
Move Up and Move Down – Will move the order of the given column. Select the row that you wish to move and use these buttons to change their order. The order of the rows in this dialog controls the order of columns in the main editor.
Grid Column Summary
The Summary button will hide and show the summary rows at the bottom of the editor:
The summary appears at the bottom of each column:
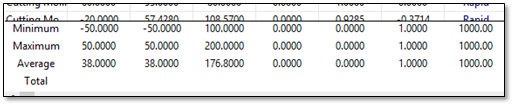
The summary shows the minimum value, maximum value, average value and total value for the column in question (if applicable).
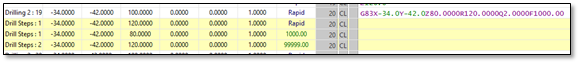
Cycle Steps
The Cyc Steps button will hide and show the cycle steps for any canned cycles:
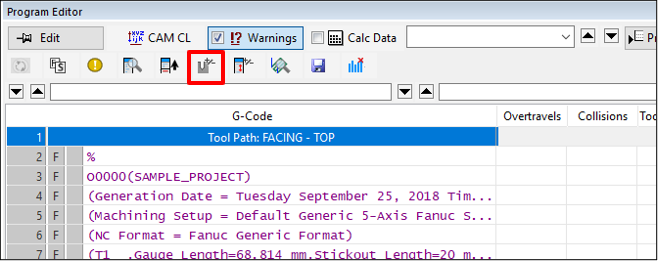
When this mode is enabled, the individual moves of the drilling cycle will be displayed in the editor. You can click on any of these lines to see where the tool will move:
Show Hidden Lines
The Show Hidden Lines button will show any lines that don’t have G-Code. They could be blank lines or command lines that don’t produce code because the mode hasn’t changed.
When this mode is enabled, blank lines will appear in the editor:
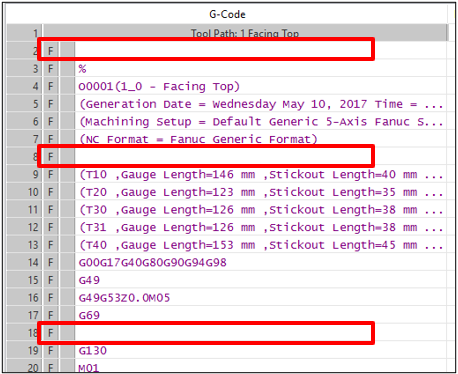
These blank lines can be the result of command lines that are intentionally blank or are codes that are for control of the post processing. Turning OFF the Show Hidden lines, will hide those lines:
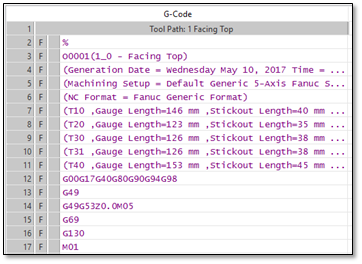
These blank lines can be the result of command macro codes or optional output codes.
Interpolated Points Navigator
The Interpolated Points button will show the list of interpolated points for any selected tool position. You must have a CL command line selected in the grid.
When this button is clicked, the Interpolated Points dialog will be shown:
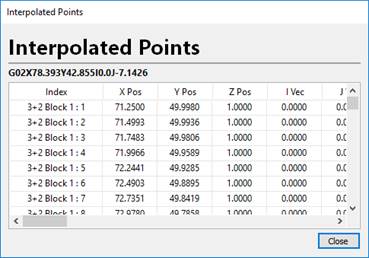
This dialog shows each interpolated point that TruePath will simulate when executing that line of G-Code. As you step through each interpolated line, the simulation will move to that location in the 3D view. While in this mode, all normal collision detection and over-travel checking will be performed. The Interpolated Points dialog is useful for investigating potential problems that might be present in your program during longer moves.
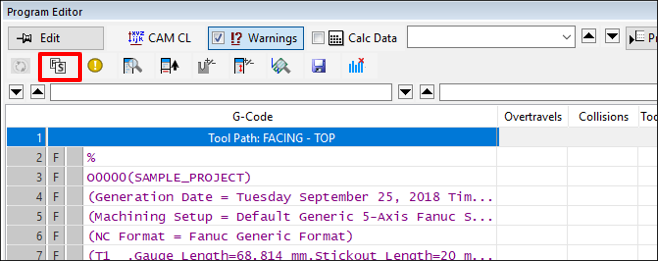
Export GCode
The Export GCode button will export G-Code for the current program(s):
The Export G-Code window will be displayed. (See The Error Summary View – Page 6)
Reset Volume Column Data
The Reset Volume Column Data button will reset any calculated volumetric removal data stored with your tool paths.
When this button is clicked, a confirmation dialog will appear. Click Yes to reset the data.