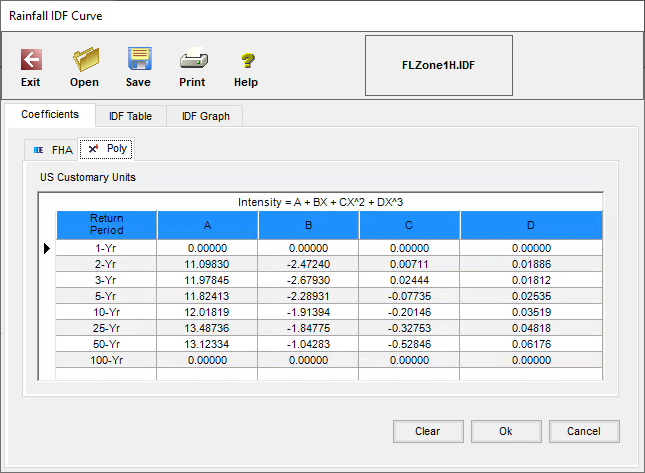
The Hydraflow Extensions include a Rainfall Intensity-Duration-Frequency (IDF) Curve dialog box, used for entering rainfall data and/or importing files that contain rainfall data. In the Rainfall IDF Curve dialog box, as shown in figure 6, there are equations you can use to create an IDF graph. You can also enter rainfall data at a constant rate instead of using the default IDF graph.

Figure 6: Default IDF Graph
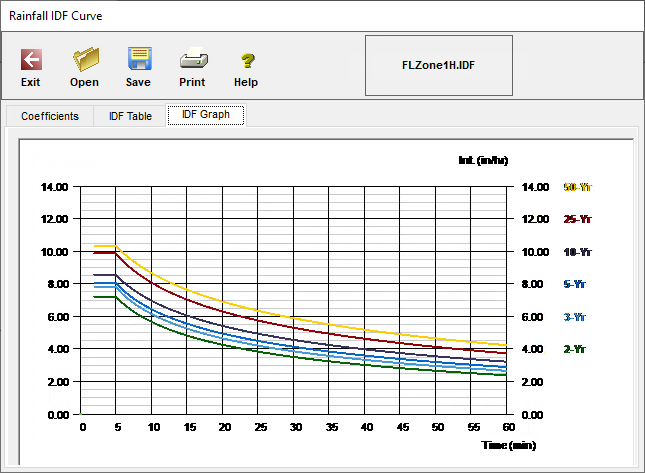
The dialog box and a graph resulting from one of the equations, as shown in Figure 7. In the graph shown in figure 7, note the curve in the graph of rainfall (in/hr) over time.
It is often desirable to set this data (in/hr) at a constant rate over time which would display the information as a straight-line graph rather than a curve.

Figure 7: Default graph curve
Set a Constant Rainfall Rate
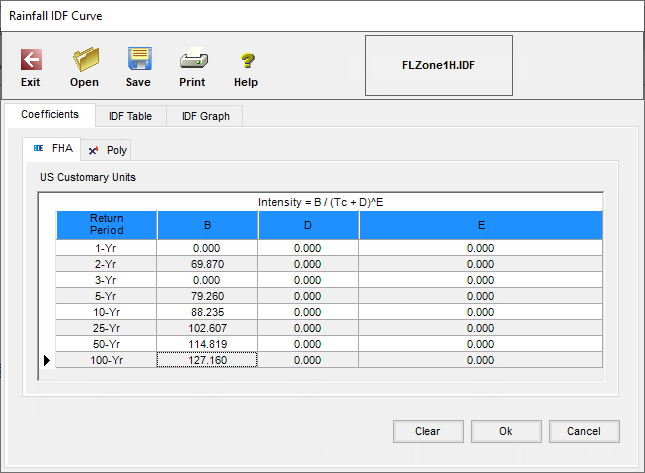
It is recommended that you take advantage of the FHA equation and manipulate the values to create a constant rate. There are three coefficients in this equation, as shown in figure 8, but only one of them will have an actual value.
The coefficients for the equation are B, D, and E. You should set the values for D and E to zero (0). The B value would be the intensity in inches/hour. Click OK at the bottom of the dialog box to save the changes.

Figure 8: Set values for constant rate.
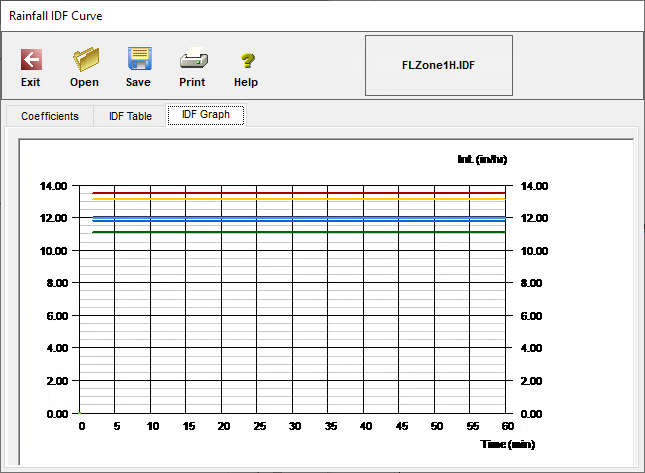
The resulting graph as shown in figure 9 is a straight-line graph, as you would expect from a constant rate.

Figure 9: Graph displays a constant rate