Grading Optimization
The Grading Optimization for Civil 3D facilitates grading for land areas based on established design criteria.
In this Have You Tried article we’ll take a look at the Grading Optimization extension in Civil 3D and how it can be used to evaluate land development solutions according to specified design criteria.
In each Have You Tried article, we profile a useful feature or workflow in Civil 3D. We look across what's new, what's been around for a while, and we identify features that can improve your experience with Civil 3D while making you and your team more productive.
Do you have a feature you want to see covered? Provide your feedback at the bottom of the page and let us know in the comments section.
What is it?
The Grading Optimization for Civil 3D facilitates grading for land areas based on established design criteria. The application uses optimization algorithms to establish surface smoothness while adhering to user-established constraints such as grading and drainage elements.
Visualization tools allow you to watch the optimization process in real-time. Using several visualization themes for the surface (violation, cut-fill, or elevation), or by watching the trends of the convergence plots, you can stop and change designs or let it run until a desired grading solution is found.If a solution is not possible, a best approximation is provided to your constraint requirements.
Why use it?
For civil designers, point grading can be a time-intensive, meticulous process. To evaluate a single grading solution, you may be spending a day or two to create the grading model, edit, and then finalize the grading model.
Grading Optimization for Civil 3D allows you to save time and energy to identify grading objects in the Civil 3D drawing (building pads, ponds, zones, curbs), and then run a grading analysis defined by a set of parameters and constraints. You can watch in real-time as Grading Optimization works to establish a solution based on grading limits, drainage requirements, and more.
Outside of the time saved using Grading Optimization, you can reduce costs by identifying challenges earlier in the grading process, minimizing material waste and optimizing earthwork volumes.
Where can I find the Grading Optimization extension?
Grading Optimization is available for customers with access to one or more of the following:
- An Autodesk AEC collection.
- An Enterprise Business Agreement (EBA) with a token flex licensing model. For EBA customers, contact the company's Account Team to have Grading Optimization added to the list of products.
- Occasional usage through tokens as part of the Flex offering.
Grading Optimization requires a separate installation and is installed in a separate directory: C:\Program Files\Autodesk\Grading Optimization (YEAR).

Once installed, Grading Optimization can be found under the Analyze tab in the Grading Optimization tab.
Interface Guide
The following image shows the main elements of the Grading Optimization interface. It may appear slightly different depending on the software from which you are using the Grading Optimization tools.
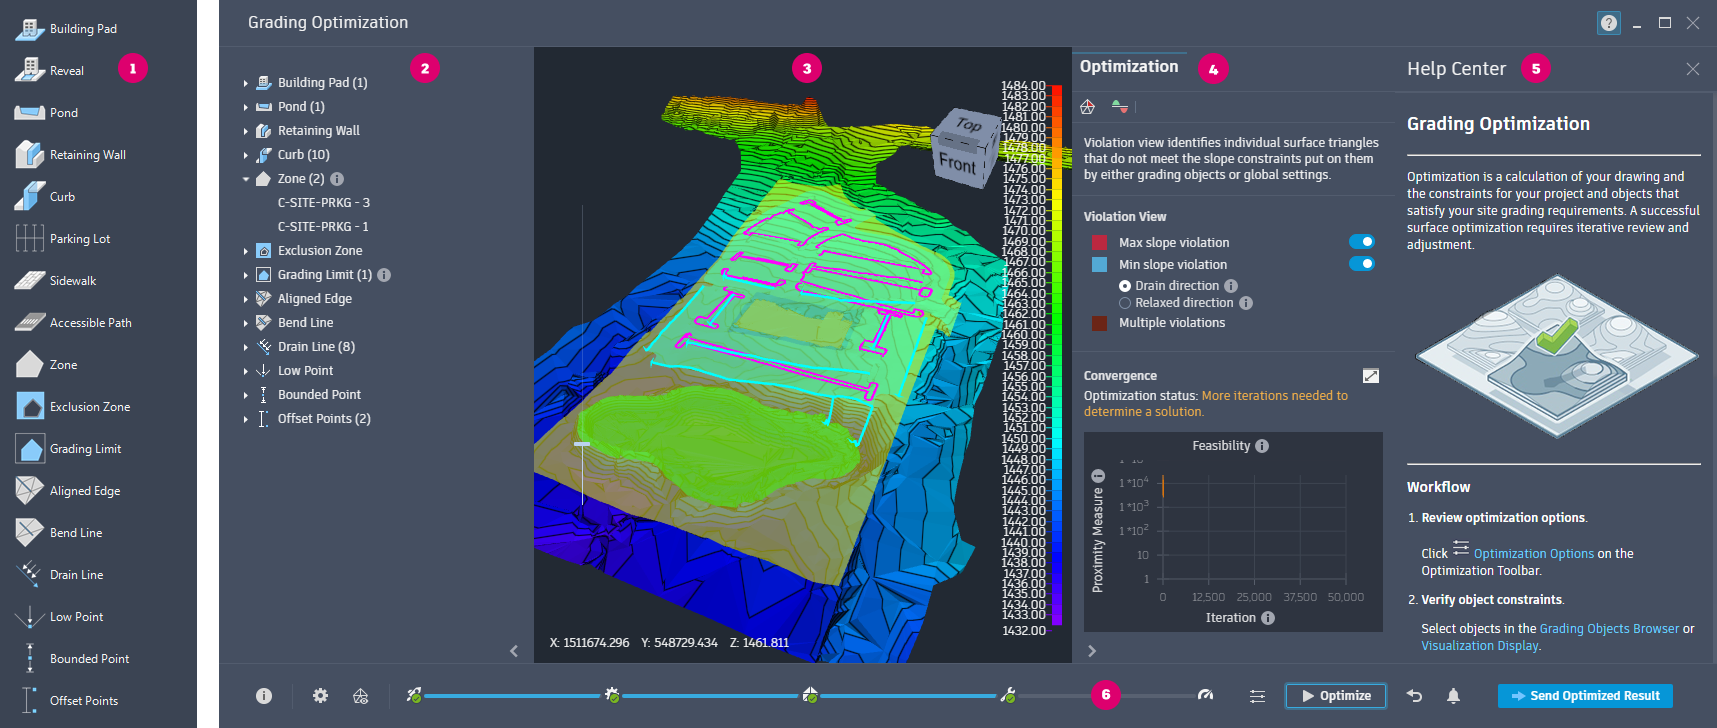
 Grading Object Tool Palette - This tool palette in Civil 3D allows you to tag drawing elements as grading objects for optimization. Each object listed contains default constraint data. You can right-click any object tool to edit the default values applied when used, or create additional customized objects.
 Grading Objects Browser - This tree directory categorically displays each object tagged from the drawing. Selecting a grading object will display the currently specified constraints assigned to it.
 Visualization Display - This is the viewing area for the optimized grading data. Several display themes are available to view the surface during and after optimization. The slide to the left of the display exaggerates the contours of the surface to help view subtle changes in elevation.
 Optimization Toolbar - This bottom band of tools allows you to specify global constraints, mesh and triangle quality, visualization options, and convergence plotting views. Once everything is specified, click Optimize to begin the process.
 Help Center - This panel provides in-context guidance as you work in Grading Optimization. Workflows, example drawings, and links to relevant learning content are also available.
 Optimization Toolbar - This bottom array of tools allows you to specify global constraints, mesh and triangle quality, visualization options, and convergence plotting views. Once everything is specified, click Optimize to begin the process.
How do I use Grading Optimization?
When using the grading optimization tool, you will first need an existing topography to build on.
Draw basic grading information onto the topography. This information could involve drawing the outline of the grading area or defining the low point of the grading model.
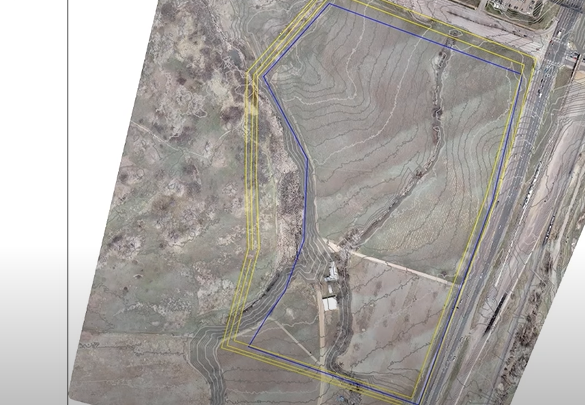
Navigate to the Analyze tab in Civil 3D and select Grading Objects Tools from the Grading Optimization panel to open the Grading Object Tools Palette. The Grading Objects window allows you to define the grading objects in your model. These can include drain lines and zones.
Note: You can right-click a tool to cut/copy, paste, and rename to create your own preconfigured tools.Define a grading object in the drawing by selecting a grading object from the browser window and then selecting the objects in the drawing that you want to define as a grading object.
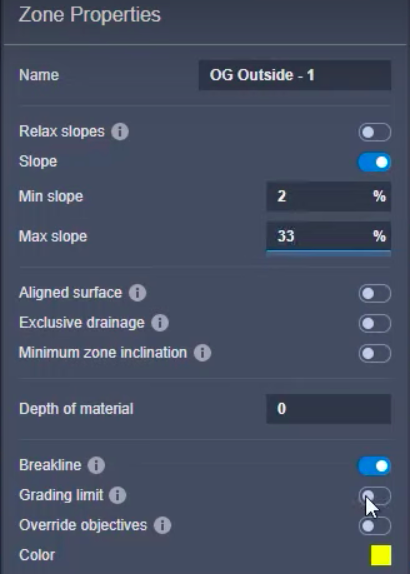
From the tool palette, choose which type of grading object you want to create and then select the objects that will be included as part of the selected grading type.
Once you create the grading objects, they will be listed in the Grading Objects Browser.
When you have established the grading objects, you can edit the object. To edit the grading object, select the grading object in the drawing or by selecting it from the Grading Object Browser. With the Grading Objects window open, you can edit the properties of each object by right-clicking an object and selecting Properties.
After defining and editing the grading objects, select the Optimize tool from the Grading Optimization panel. The Grading Optimization extension will appear in a separate window.
In the grading Optimization window, the previously created grading objects are visible on the existing topography. The Grading Object browser allows you to edit each of the objects.
Begin the grading optimization by clicking Optimize from the bottom toolbar. You can stop the optimization process at any time by clicking Stop from the bottom toolbar.
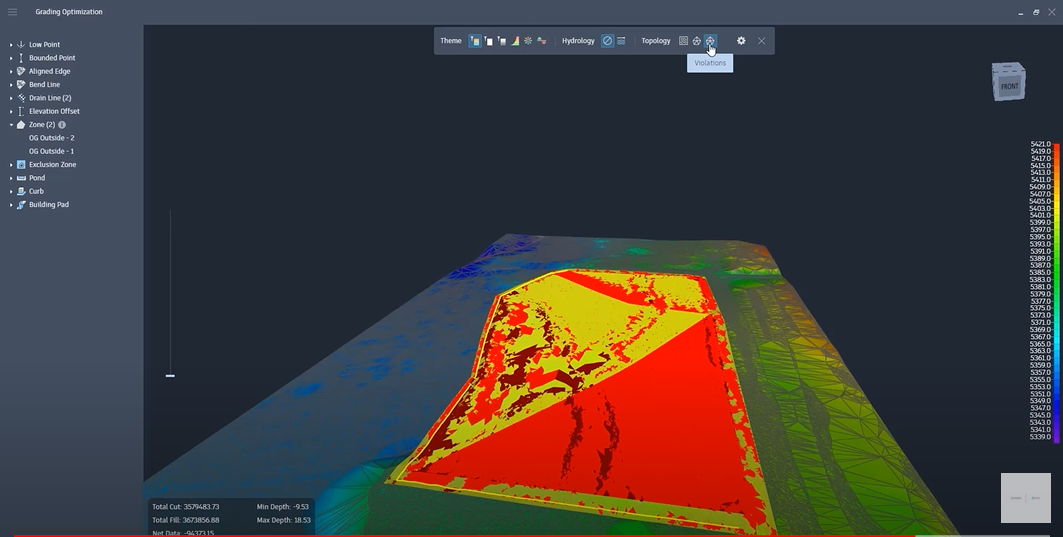
You can view the optimization process by clicking the Visualization Toolbar icon
 at the bottom of the interface. The toolbar will display in the model space.
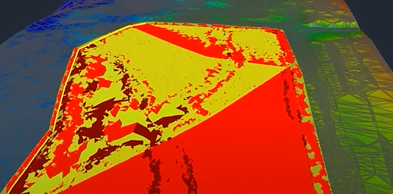
From the visualization toolbar, you can choose from the visualization themes including Violations, Cut-Fill, and Elevation.
While the tool runs, the number of violations should hit a minimum amount. If you are satisfied with the optimization you can stop the process and send the resulting surface to Civil 3D as its own TIN Surface.
Additionally you can click Convergence Plots from the bottom Toolbar to view the optimization progress as it works within the established parameters.
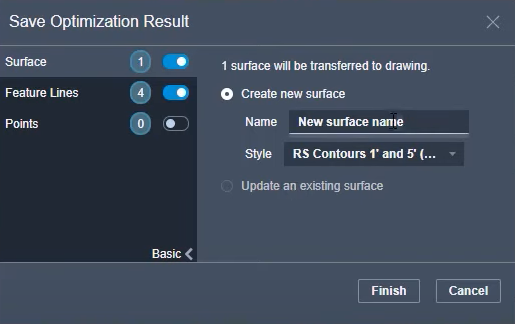
To send the graded surface to Civil 3D, click the button Send Optimized Result button from the bottom toolbar. In Civil 3D, you should see a new window appear. The optimized surface can be transferred to the drawing as a new surface or it can update an existing surface.
Name the optimization result and choose the style you wish to save the result.
