This tutorial demonstrates the use of Project Explorer to generate a simple Civil 3D Alignment/Profile report to a PDF file. You will then write the same report to an Excel XLSX file.
Getting started
In Autodesk Civil 3D, open the standard Civil 3D sample drawing: Intro-1.dwg
This drawing is part of the standard Civil 3D installation, and can generally be found in the following folder:
C:\Program Files\Autodesk\AutoCAD 2022\C3D\Help\Civil Tutorials\
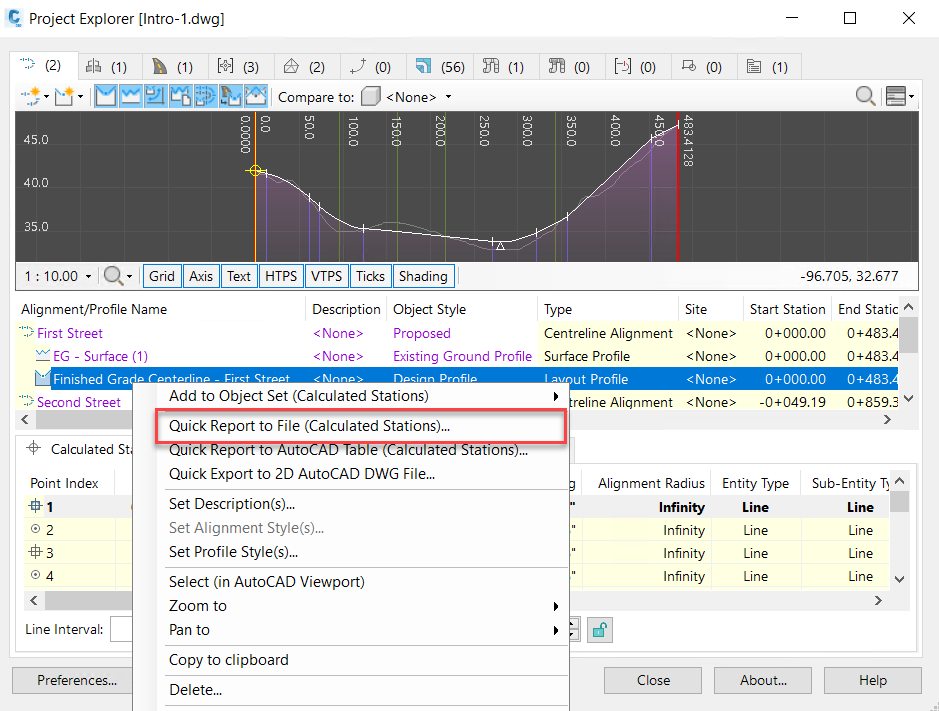
There are two ways to generate reports in Project Explorer. The quickest, easiest way to generate a report of a single element from your Civil 3D model is to use the Quick Report function. Right-click any listed item in the Project Explorer window to access the associated Quick Report options.
- From the Civil 3D ribbon, select the Add-Ins tab and click Launch Project Explorer to and open the Project Explorer window.
- On the Alignments tab of the Project Explorer window, locate the alignment Second Street, and right-click the associated profile: Finished Grade Centerline - Second Street Design.
- Select
Quick Report to File from the right-click menu.
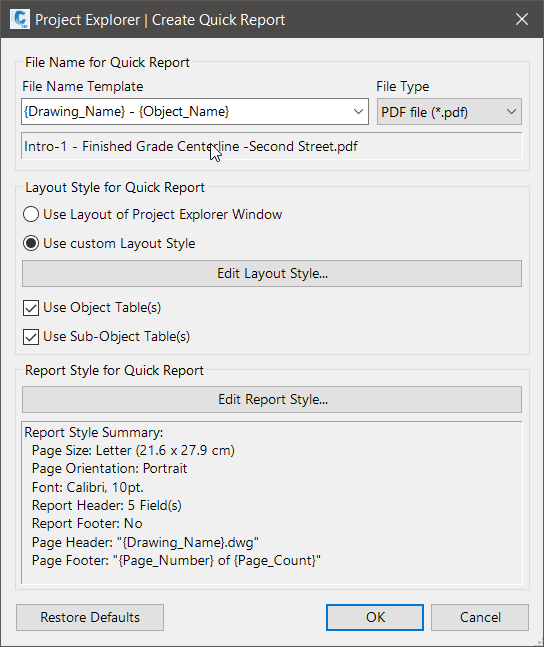
The Create Quick Report dialog opens.
Configuring your quick report
To generate a Quick Report you need to choose a file type for the report, then configure the content and layout of the report using a Layout Style and a Report Style.
Layout Styles define the heading, visibility, and order of every column of data in the report. The units of numerical values can also be controlled from a Layout Style.
Report Styles define the page formatting, fonts, table style, and header/footer content of outgoing reports.
Layout and Report Styles can be saved and retrieved at any time, but for this tutorial you will define your requirements manually.
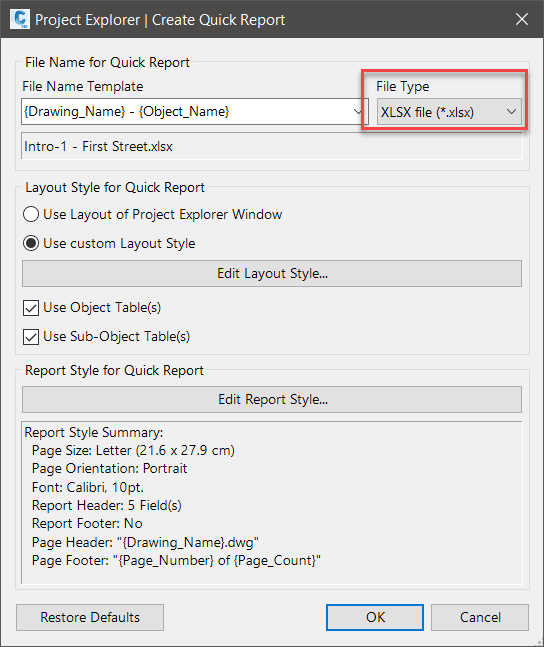
- Ensure that the File Type drop down list is set to PDF File. Note that the file name of the outgoing report file can be derived from a series of dynamic variables during the creation process, or you can specify a fixed file name in this dialog. By default, the report file name will be made up of a combination of the drawing name and selected object name.
- Change the Layout Style setting to Use custom Layout Style, then click the Edit Layout Style button.
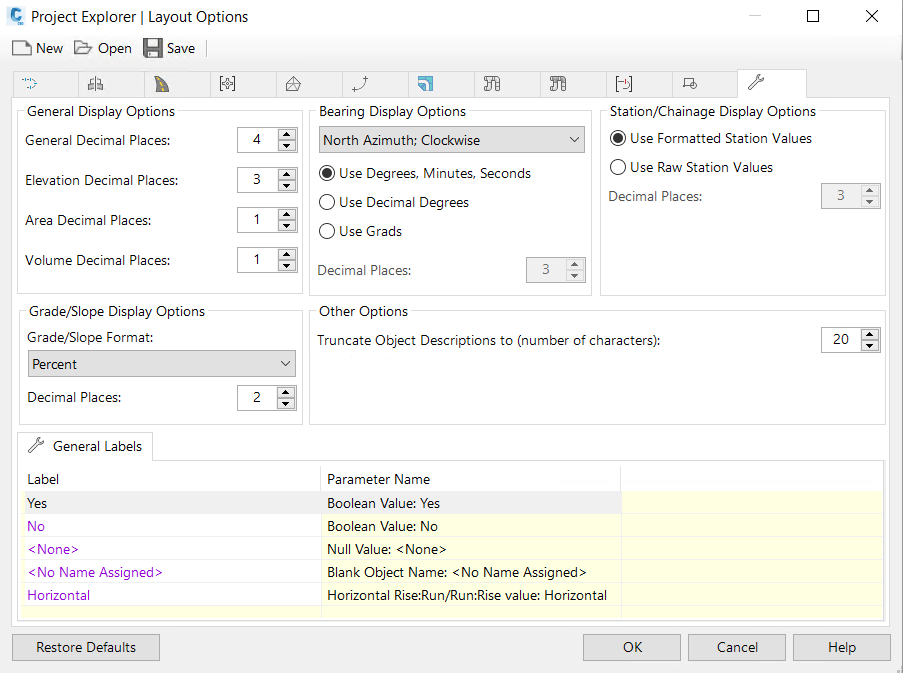
Layout style options
From this dialog box you will define the layout of the outgoing report.
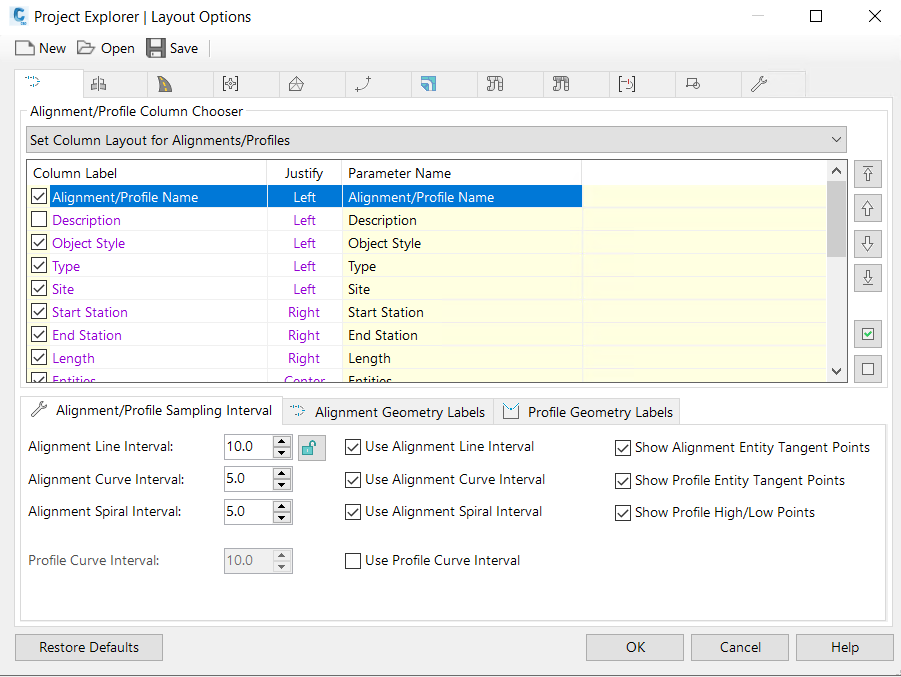
- In the Alignments tab of the Layout Options dialog box, ensure that Set Column Layout for Alignments/Profiles is selected.
- From the list view, ensure that just the first seven columns are selected: Alignment Name, Type, Object Style, Site, Start Station, End Station, Length.
- At this point, you may rename or reorder any of the selected columns to match the standards in your organisation. Columns may be renamed by double-clicking on the required label, or by right-clicking and selecting Rename from the right-click menu.
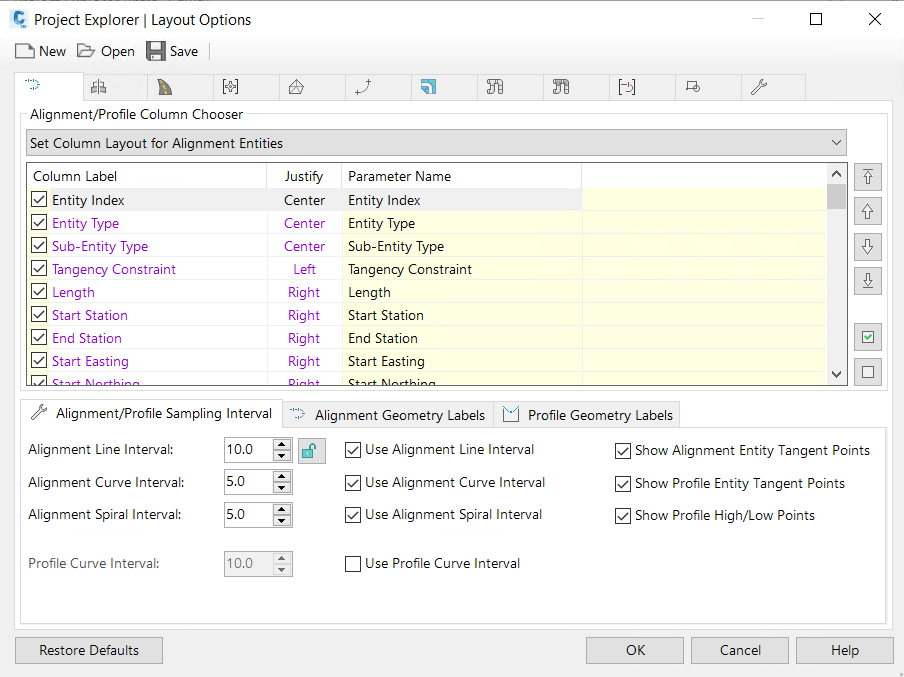
- Change the drop-down list on the Alignments tab to Configure Column Layout for Alignment Entities/Points .
- From the list view, ensure that just the following columns are selected: Point, Station, Easting, Northing, Elevation, Bearing, Alignment Radius, Gradient, Profile Radius. Rename and reorder any of the selected columns to your own requirements.
- From the Alignment/Profile Options controls, set a desired Line, Curve, and Spiral interval for the outgoing Quick Report.
- Select the General tab and note the options here to set the format of numerical values such as angles/bearings, stations, elevations, and slopes. Changes applied here will only affect the outgoing Quick Report.
- Click OK to close the Layout Options dialog and return to the Quick Report dialog.
Report style options
Next, you'll specify the style of the outgoing report.
- Click the
Edit Report Style for Quick Reports button. The
Report Options dialog opens.
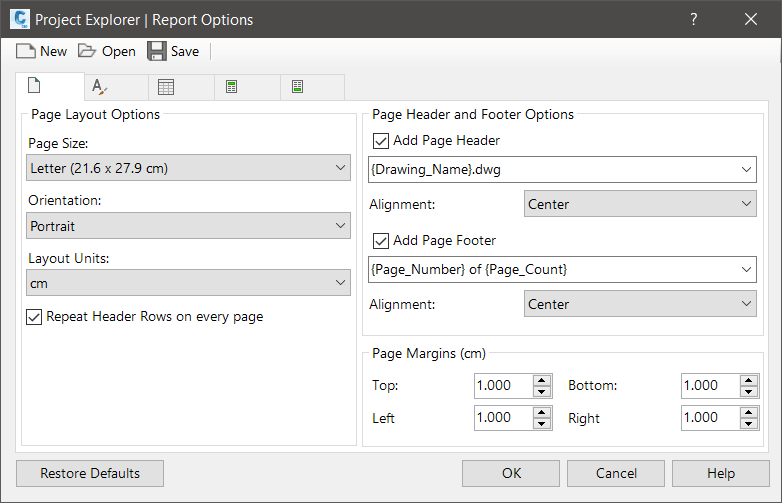
- On the Page Options tab, set the Page Size to A4, and the page orientation to Portrait.
- On the Font Options tab, set the Preferred Font to Corbel and the font size to 10pt.
- On the Table Options tab, set the Header Row Background Color to Pale Yellow, or a color of your choice.
- Optionally, on the Report Header tab, select the Add Image to Header checkbox and click the Browse button to select a company logo image file from your computer.
- Finally, click OK to close the Report Options dialog and return to the Quick Report dialog.
Generate the report
- You are now ready to generate the report. From the Quick Report dialog, press the OK button and choose a path in which to save the PDF report file.
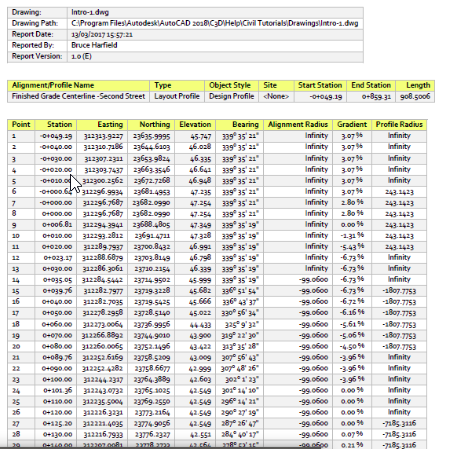
- The report is generated. Open Adobe Acrobat to inspect the resulting report file.
If you wish to change the layout or style of the report, right-click the same object in the Project Explorer window and select the Quick Report to file option again. Your preferences will be remembered from the previous quick report.
Writing the same report to Excel
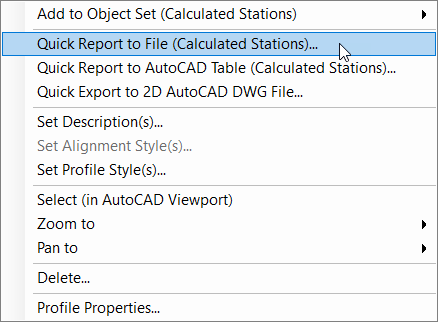
On the Alignments tab of the Project Explorer window, relocate the alignment Second Street, and right-click the associated Finished Grade Centerline - Second Street Design Profile.
Ensure that the Calculated Stations sub-object tab is selected, then right-click the selected profile and select Quick Report to File (Calculated Stations) from the right-click menu.
The Create Quick Report dialog box opens.
Configuring the report for export to Excel
-
Change the file type to XLSX file to generate an Excel file.
As you have previously configured your report settings, you can just accept the current layout style and report style, or you can make some minor adjustments if you wish.
- Click the OK button to generate the file.
- Open Microsoft Excel to review the output.
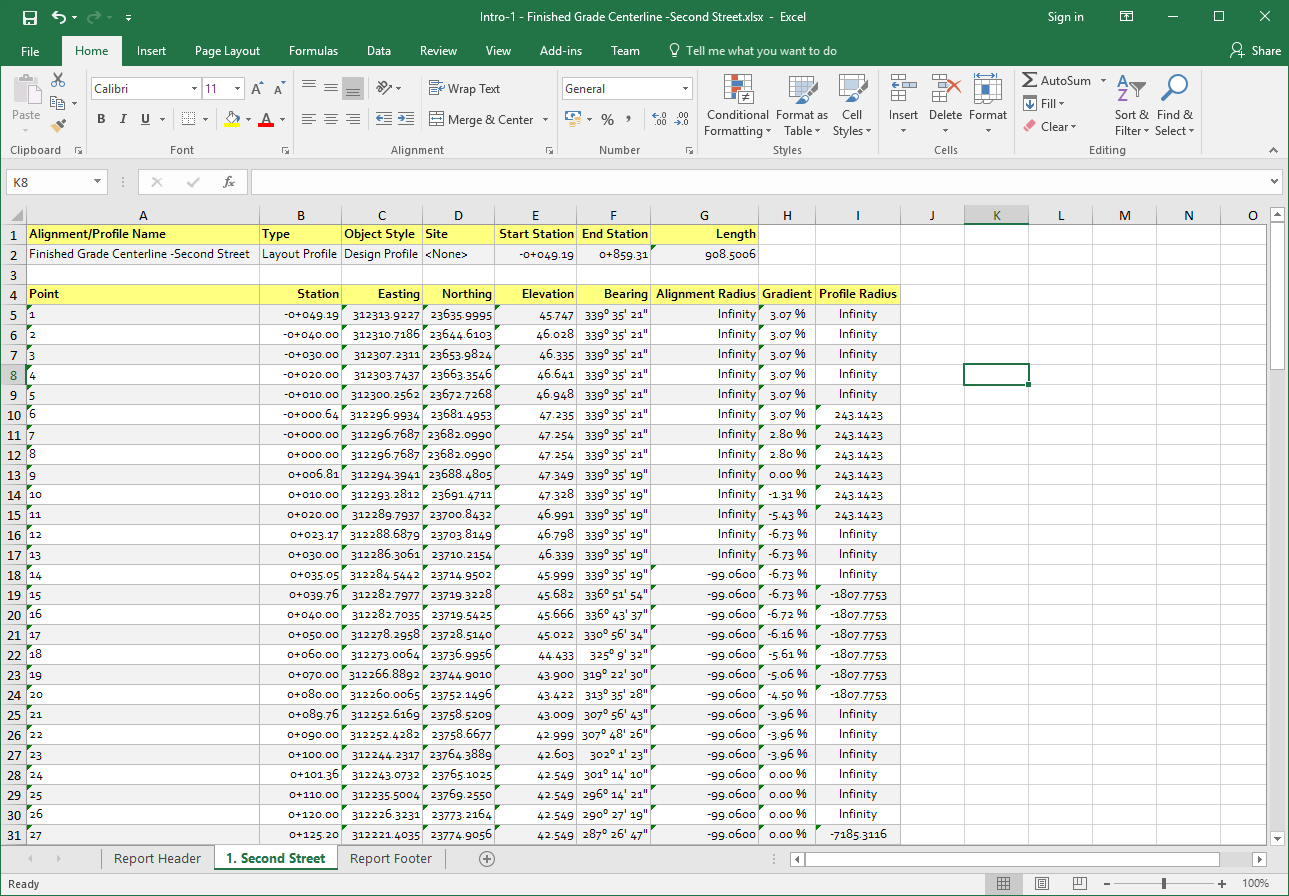
Note that three worksheets have been generated in the exported XLSX file. The first worksheet contains the report header. The second worksheet contains the selected object geometry. The third worksheet contains the Report Footer.
- To prevent the report header and footer from creating additional worksheets in the exported file, run the Quick Report option again and clear the Add Fields to Report Header and Add Report Footer options in the Report Style dialog.
- Project Explorer does not automatically set the width of columns in the exported Excel file. In Microsoft Excel, select the entire worksheet and select Autofit Column Width from the cell formatting options in the Excel ribbon.