Captures the Intent calls tree, measures individual call times, and builds the aggregated estimates on the calls per Part/Rule/Design/Function.
- Access
- In the <Install_Location>\Bin folder, start Intent.Tracer.exe.
As soon as Intent kernel is initialized in another application (Inventor, MinHost), the Intent.Tracer starts to gather the performance data. When Tracer starts collecting data, in the toolbar at the top of the dialog box, the controls are enabled.
-

- Opens the current log file in the analysis view.
-

- Clears the contents of the active log file, and the analysis view.
-

- Toggles the capture of the performance data.
-

- Opens and re-analyzes an existing log file.
Chronological View Mode of Analysis
The view shows the history of Intent calls. For the particular call, one can see the call duration, the containing part, and so on.
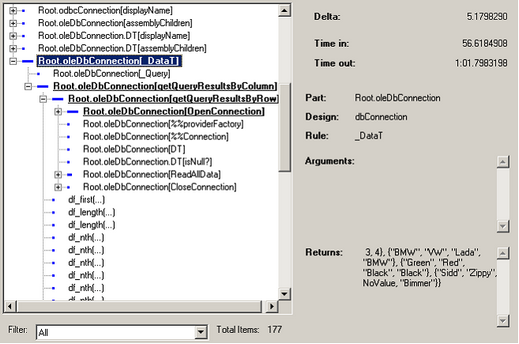
The combo box at the bottom filters out the non essential calls.
The size of the icon on the node shows the relative time that is taken by particular siblings of the tree node.
Aggregation View Mode of Analysis
Aggregation View explores the metrics (total time spent and number of hits) in the Rule/Part/Design. For example, the following shows the calls to load the Intent Parts.