Now, add a layer that displays parcels in one part of the city of Redding. This layer contains size, value, and address information about the parcels. It does not contain information about the owners. You join to a data source that contains that information later.
When you make the parcels semi-transparent, you can see the other features underneath.
This exercise uses the AnalyzeMap1.dwg map you created and modified in the previous exercises.
To add the parcel layer to the map
-
Click
 .
.
- In the Data Connect window, under Data Connections By Provider, click Add SDF Connection.
- Click
 next to the Source File field and navigate to the folder where you copied the sample files.
 - In the Open dialog box, select Assessor_Parcels.SDF and click Open.
- In the Data Connect window, click Connect.
- Click Add To Map.
- Close the Data Connect window.
- In Display Manager, select the Parcels layer and click Table.
Information associated with the parcels is displayed, but the information does not include owner-related data.
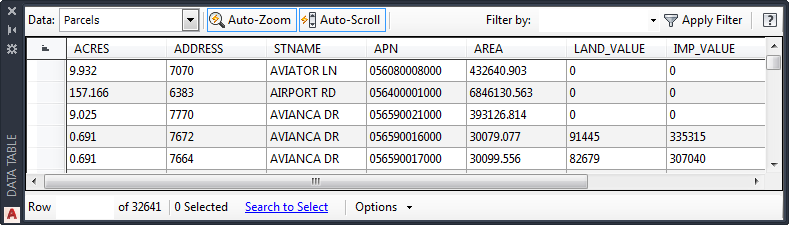
Data associated with the Parcels layer is displayed.
- Close the Data Table.
To style the parcels in the map
- In Display Manager, select the Parcels layer and click Style.
- In the Style Editor, click the color in the Style entry.
- In the Style Polygon dialog box, select the fill element.
- Move the Transparency slider to 128.
- Change the fill Color to a light shade.
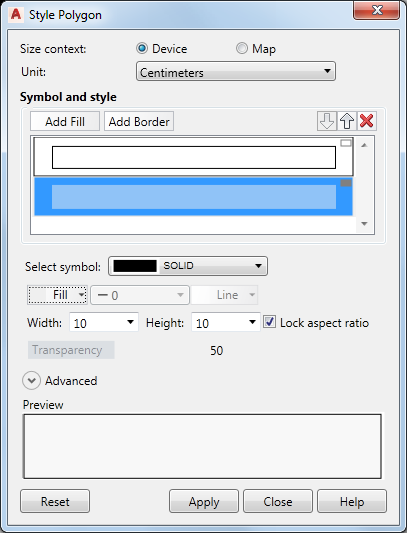
Change the foreground transparency for the parcel layer.
- Click Apply and then Close.
- Close the Style Editor.
The parcel layer is draped over the surface. Because it is transparent, you can see the surface underneath.
Where you are now
You added a surface that contains elevation information, and you used that information to create a theme that varies color by elevation. You added contour lines to identify the elevation levels. You draped a layer of data over the surface and made it transparent so you could evaluate its elevation based on the surface beneath it.
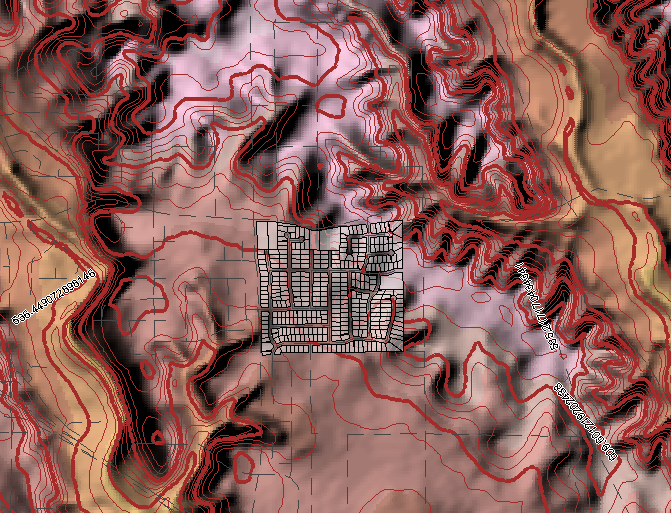
The styled surface helps you evaluate parcel elevation.
To continue this tutorial, go to Lesson 2: Analyze Data With External Information Using Joins