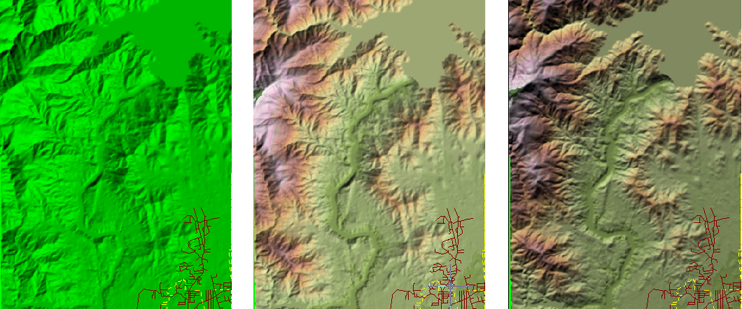
 After you add a raster-based surface to your map (such as a Digital Elevation Model or ESRI Grid file), you can analyze it in various ways.

This illustration shows: the default appearance of a 3D surface (left), themed by elevation (center), with hillshading (right).
Analyze a raster-based surface (such as a Digital Elevation Model or ESRI Grid file) in the following ways.

|
Add contour lines to a surface to make a contour map, also referred to as a topographic map. |

|
Drape 2D map data on 3D surfaces to view all the data as a 3D texture map. |

|
View, navigate, and walk or fly through a 3D map to view the map from different perspectives. |

|
Use hillshading to cast real-world shadows on a surface to make it look more realistic and easier to analyze. |

|
Change the vertical exaggeration to control how extreme the elevation changes appear. |

|
Use theming and change colors to analyze elevation, slope, aspect, and more. |