When you set driven keys, the curve created in the Graph Editor shows the relationship between the linked attributes.
For regular animation keys, the vertical axis in the
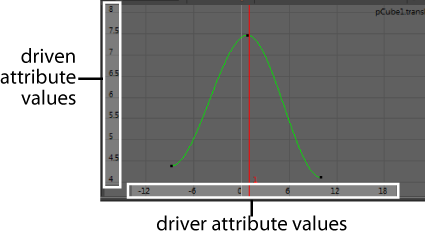
Graph Editor shows attribute values, and the horizontal axis shows animation time values. For driven keys, the vertical axis lists driven attribute values, and the horizontal axis lists driver attribute values.
For each attribute value of the driver, the curve shows the associated value of the driven attribute. You can edit the curve to alter the relationship.
To view driven key associations in the Graph Editor
- Select the driven object.
- Select Window > Animation Editors > Graph Editor from the main menu.
- In the
Graph Editor, select
View > Frame > Frame All.
The curve in the Graph Editor shows the relationship between the values of the driven and driver objects. The column of numbers on the left lists the driven attribute values, and the row at the bottom lists driver attribute values.
- (Optional) Edit the shape of the curve in the Graph Editor to adjust the behavior of the linked objects.