Description
The TABLES1 entry defines a tabular function for stress-dependent material properties such as the stress-strain curve.
Format
| 1 | 2 | 3 | 4 | 5 | 6 | 7 | 8 | 9 | 10 |
| TABLES1 | TID | ||||||||
| x1 | y1 | x2 | y2 | x3 | y3 | -etc.- |
Example
| TABLES1 | 45 | ||||||||
| 0.0 | 0.0 | 0.02 | 10000. | 0.04 | 14000. | ENDT |
| Field | Definition | Type | Default |
|---|---|---|---|
| TID | Table identification number. | Integer > 0 | Required |
| xi, yi | Tabular values. | Real | 0.0 |
Remarks
- xi must be ascending order.
- Discontinuities may not be specified between any two points.
- At least one continuation entry must be specified.
- The end of the table is indicated by the existence of ENDT in either of the two fields following the last entry. Any continuations that follow the entry containing the end-of-table flag ENDT will be ignored.
- TABLES1 uses the following algorithm:
y = yT(x)
where x is input to the table and y is returned. The table look-up is performed using linear interpolation within the bounds of the x values of the table. Outside the bounds the function is assumed to be constant. That is, if x is less than x1, then the function evaluates as y1. If x is greater than xN, then the function evaluates as yN. The function evaluates as follows:
X axis Y axis y(x) Linear Linear 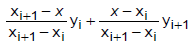
In the above equations, xi < x < xi+1.