To setup a table, in the Inventor Nastran Model Tree, right-click on Tables and select New. Double-click on the cells to input your values.
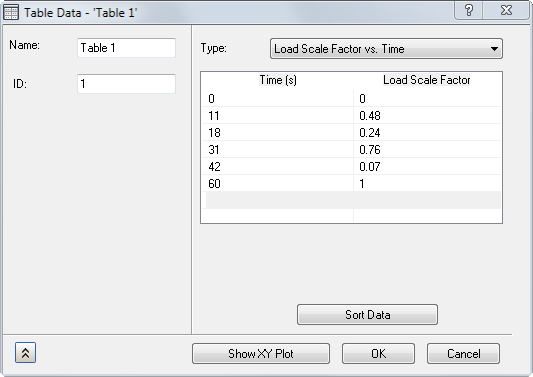
- Name: Names the table.
- ID: The ID of the table is automatically updated by Inventor Nastran.
-
Type:
- Dimensionless-User Defined: Creates a user-defined table.
- Load Scale Factor vs. Time: Used for creating transient loading for dynamic analyses, such as Direct Transient and Modal Transient.
- Structural Damping vs. Frequency: Used for creating varying modal damping for modal-based dynamic analyses. Damping values are in the units of g=2C/C0.
- Critical Damping vs. Frequency: Used for creating varying modal damping for modal-based dynamic analyses. Damping values are in the units of critical damping C/C0.
- Q Damping vs. Frequency: Used for creating varying modal damping for modal-based dynamic analyses. Damping values are in the units of amplification or quality factor, Q. Quality factor is calculated by 1/(2C/C0).
- Load Scale Factor vs. Frequency: Used for creating frequency dependent loading for dynamic analyses such as Direct and Modal Frequency Response.
- Load Phase vs. Frequency: Used to define a change in load phase for Frequency Response solutions.
- Convection Coefficient vs. Temperature: Used for temperature dependent convection coefficients in Nonlinear Heat Transfer analyses.
- Emissivity vs. Temperature: Used for temperature dependent emissivity in Nonlinear Heat Transfer analyses.
- Load Scale Factor vs. Temperature: Used to define temperature-dependent Young's modulus and thermal conductivity.
- Heat Generation vs. Temperature: Used to define temperature dependent Heat Generation.
- PSD (Acceleration) vs. Frequency: Used to define a power spectral density (PSD) curve in terms of acceleration with frequency for Random Response solution.
-
PSD (Force) vs. Frequency: Used to define PSD curve in terms of force with frequency for Random Response solution.
-
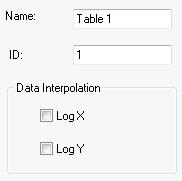
Data Interpolation: Specifies a linear or logarithmic interpolation for the x-axis or y-axis in case of PSD curve definition. When LogX and LogY is unchecked it is linear interpolation and if checked then it is logarithmic.
-
Data Interpolation: Specifies a linear or logarithmic interpolation for the x-axis or y-axis in case of PSD curve definition. When LogX and LogY is unchecked it is linear interpolation and if checked then it is logarithmic.
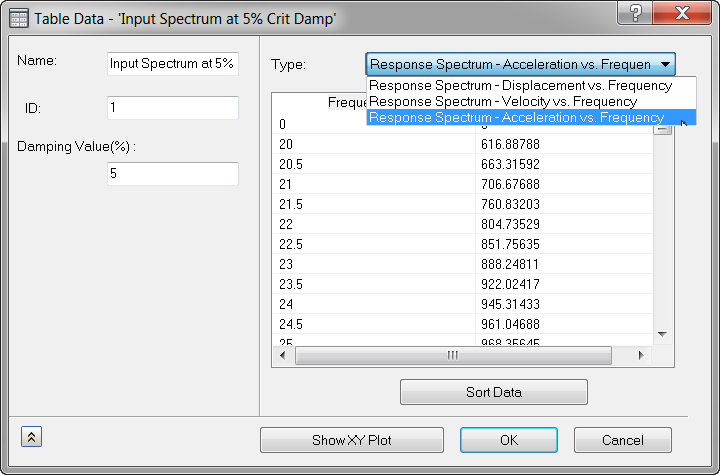
- Response Spectrum - Displacement vs. Frequency: Used for measuring linear displacement of points in response to a range of frequencies.
- Response Spectrum - Velocity vs. Frequency: Used for measuring linear velocity of points in response to a range of frequencies.
-
Response Spectrum - Acceleration vs. Frequency: Used for measuring linear acceleration of points in response to a range of frequencies.
- X-Column: Input X-axis data.
- Y-Column: Input Y-axis data.
- Sort Data: It allows to sort the data if it is required. Once the data is sorted you cannot revert it back.
-
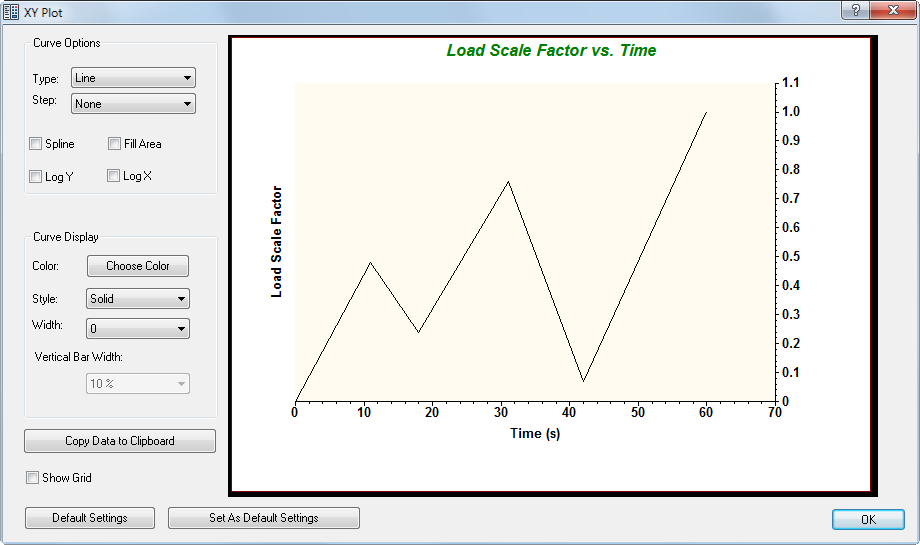
Show XY Plot: Generates a graphical representation of the Table (XY Plot). The example shown below was derived from the user input on the previous page.
-
XY Plot has the following features:
-
Curve Options:
- Type: You can select between Line, Line+Symbol, Scatter, or Vertical Bars.
- Step: You can set the step at the Start, End, or None. This option is only available when Line is selected under Type.
- Splines: When this option is checked, a smooth continuous line is used to connect the data points. This option is only available when Line+Symbol is selected under Type or when Line is selected under Type and None is selected under Step.
- Fill Area: When this option is checked, the area underneath the curve is filled in. This option is only available when Line is selected under Type.
-
Curve Display:
- Color: The color of the curve can be changed by clicking on Choose Color.
- Style: Solid or a variety of dashed and/or dotted line styles are available.
- Width: Adjusts the line thickness.
- Vertical Bar Width: Adjusts the width of the bars when Vertical Bars is selected under Type.
- Copy Data to Clipboard: Copies the data into the clipboard where it can be pasted into a table or database, such as a Microsoft Excel spreadsheet, Notepad, Wordpad, etc.
- Show Grid: Displays a grid when this option is checked.
- Default Settings: Resets all the settings to the default ones.
- Set As Default Settings: Allows you to define the current settings on the form as the default settings. These will become the settings XY Plot will revert to, when Default Settings is selected.
- OK: Closes the XY Plot window.
-
Curve Options:
-
XY Plot has the following features:
- OK: Creates the table.
- Cancel: Cancels table creation.