*LFUS
r1
r1: Melt Temperature (or other test temperature)
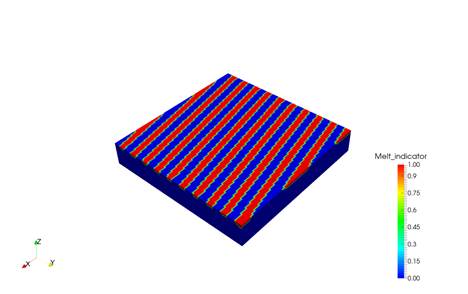
*LFUS creates two new output results in the Ensight format for moving heat source thermal simulations:
- Melt Indicator: This ParaView field will produce a binary color contour plot where any element which experiences a temperature greater than r1 has a value of 1 and any temperature less than or equal to r1 has a value of 0. This allows the user to investigate regions that may experience lack of fusion due to the chosen process parameters.
- Peak temperature: This field records the peak temperature during each time increment.
Examples of these two new fields are shown in the figures below.

Peak temperatures

Melt indicator
Best practices: Use with *ENSF to improve resolution of *LFUS results.
Note: This will create aberrations in the normal temperature contour as temperatures from non-active nodes will still be shown.