Curvature shading displays the curvature of a surface to help detect any defects. It can also help decide the optimum tool cutter size. Curvature shading can be considered as a form of surface inspection. It allows you to check the surface of a model in several ways. These include:
- highlighting surface ripples.
- showing the smoothness of the surface.
- showing how surfaces blend with one another.
This type of shading helps when designing products that need to have an aesthetic appearance. The shading indicates the level of curvature of the surface and whether the surfaces merge well with one another.
- Click Visualisation tab > Shading panel > Curvature.
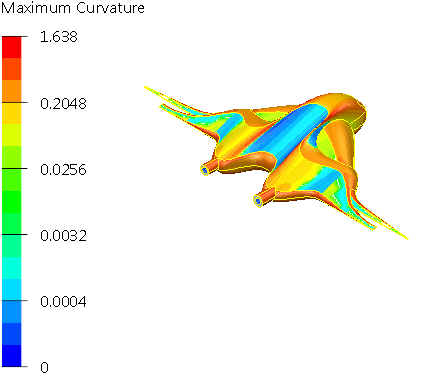
The surfaces in the model are painted using curvature shading, different colours are used to represent the different curvature on the surfaces.
Curvature at a point on a curve is defined as:Curvature = 1/r
where r is the radius of the arc which fits the curve at that point. Radius r is also known as the radius of curvature.Curvature maps can be hard to interpret, and it is usually the case that the variations in curvature rather than absolute values are of more interest when viewing a curvature shaded surface. Irregular variations in curvature tend to indicate poor quality surfaces.
Curvature of a point on a surface is obtained by intersecting the surface with a plane through the point to give a planar curve. The curvature of the point is then taken as the curvature of the point on the planar curve. At any point, an infinite number of planes can intersect the surface, therefore giving an infinite number of curvatures. So, for each point, there will be a maximum and minimum curvature. These values are used for the curvature.
- Select File > Options > Application Options> Tools > Analysis > Surface Analysis to display the Surface Analysis page of the Options dialog.
- In the Curvature Shading area, specify the following options:
Type — This sets the type of curvature displayed. You can choose from one of the following:
- Minimum curvature — This is the minimum curvature at a point.
- Maximum curvature — This is the maximum curvature at a point.
- Gaussian curvature — This is the product of the minimum and maximum curvatures.
- Mean curvature — This is the average value of the minimum and maximum curvatures.
Representation Type — This controls the representation of the curvature. You can choose from one of the following:
- Banded — The curvature at each point is represented by a colour in a spectrum. The colours are in bands.
- Spectrum — The curvature at each point is represented by a colour in a spectrum. The colours change smoothly.
-
Bicolour — This shows the positive and negative curvature using two colours, regardless of whether
Signed Curvature is selected. The colour gets lighter as the magnitude of the curvature get higher.
In Banded and Spectrum shading, only the magnitude of the curvature is shown (unless the Signed Curvature option is selected). The maximum magnitude shown will be the larger of the absolute values of the minimum and maximum curvatures. The minimum magnitude shown will be the smaller of the absolute values of the minimum and maximum curvatures. The mean magnitude shown will be the mean of the absolute values of the minimum and maximum curvatures.
Scaling — Select Log or Linear. With a linear curvature scale, you would see a change in the colour of the shading more clearly if the curvature of a surface changed suddenly. To see a wider range of curvatures on the surface of a model, use the logarithmic curvature scale.
Draw Scale — Select this option to display a colour-coded key in the lower left of the view.
Signed Curvature — Select this option to display the negative and positive curvature. Deselect this option to consider only the magnitude of curvature, and the sign is ignored.