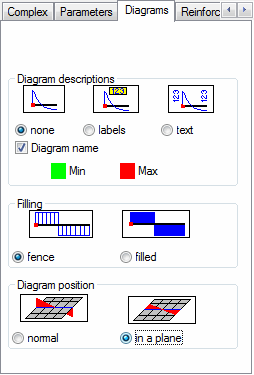
Select the Diagrams tab in the Panel cuts dialog to select the manner of structure diagram presentation.

- In the Diagram descriptions field, decide how the descriptions of selected quantities will be presented on the diagram.
- None - Descriptions of diagrams in cuts will not be presented.
- Labels - Descriptions of diagrams in cuts will be presented in the form of labels showing values at selected points of cuts.
- Text - Descriptions of diagrams in cuts will be presented in the form of values at selected points.
- Max and Min assigns a label color and descriptions for the maximum and minimum values for diagrams in panel cuts. Color can also be selected in the Preferences dialog box on the Desktop Settings tab (select plate diagrams in the Range field and minimum values or maximum values in the Element field).
- Diagram name assigns the name determined in the Cut name field on the Definition tab to a diagram created for a defined cut.
- Positive and negative values selects whether positive and negative values of the presented quantity will be marked with different colors (not differentiated and differentiated).
- Filling of a diagram: fence or filled
- Diagram position field, sets the position of the diagram with respect to the structure:
- normal - the diagram of the selected quantity will be drawn as tangential to the plane of the cut (that is normal to the structure plane).
- in a plane - the diagram of the selected quantity will be drawn as normal to the plane of the cut (such as in the plane of the structure).
Note: When diagram descriptions are presented along cutting lines, maximum and minimum values are presented for the diagram, as well as the value of the integer for the selected component along the cutting line length.