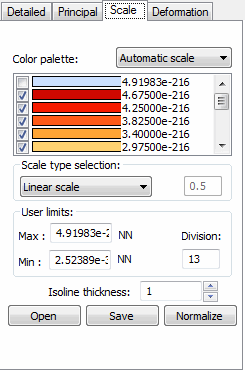
Select the Scale tab in the Maps on Solids dialog to adjust presentation scale.

Scale values for maps are set to defaults. The map presentation parameters, however, may be changed.
- Select the type color palette type (automatic scale, 16 colors, 256 colors, shades of green, shades of blue, shades of red, shades of gray). To change a color, double click where a given color is presented and select a different color in the dialog. You cannot change colors in the automatic scale.
- Select the scale type (linear, logarithmic, any - defined by a user). If the scale type: any is selected, to change a color value, double click where a given color value is presented and edit accordingly.
- Select the maximum (upper) and minimum (lower) division number in which to display a map of a quantity (these may be disabled) and define the map color change division number (the number of divisions into which the chosen map has been divided).
- Enable the colors to be presented on the map and values for these colors.
At the bottom there are the following buttons:
- Click Save to save the palette of colors to a file.
- Click Open to open a palette of colors from a file.
- Click Normalize to normalize a color palette. Normalization of scale adjusts a selected quantity by adopting the maximum and the minimum values of the selected quantity as the range limits.
Right clicking in the palette of colors on the Scale tab you can select the following.
- Copy. Copy the palettes of colors to the clipboard. You can paste it to other programs, such as MS Excel.
- Paste. Pastes a palette of colors from the clipboard. Palettes may be prepared in other programs, such as MS Excel, and then pasted into the Scale dialog.