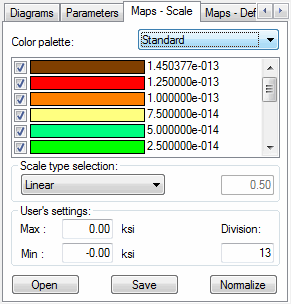
On the Maps - Scale tab in the Stress Analysis - Structure dialog, you can select the color palette for a stress map used in the generated 3-dimensional structure view.

Change the presentation parameters of stress maps:
- Select the color palette
- 16 colors
- 256 colors
- shades of green
- shades of blue
- shades of red
- shades of gray
To change a color on a palette, double-click the color, and then select a different color in the Color dialog.
- Select the colors to use for the quantity map
- Select a scale type
- Linear
- Logarithmic
- User-defined
When you select User-defined, you can change a color on a scale by double-clicking the color, and then selecting a different color in the Color dialog.
- Specify User's settings
- Maximum - force value expressed in kips/square inch
- Minimum - force value expressed in kips/square inch
- Division - number of divisions into which the map of the selected quantity will be divided
- Colors to use in a map of the quantity and values for colors.
You can save the color palette to a file, open it from a file, or normalize it. Normalization of the scale adjusts the scale of a selected quantity by adopting the minimum and the maximum values of the selected quantity as the range limits.