After you select the Section XZ tab in the Stress Analysis dialog, the extreme stresses obtained in the selected XZ bar section are presented.
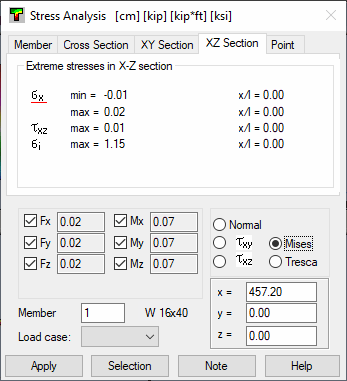
In the Stress Analysis dialog, the following extreme stresses calculated in the selected longitudinal bar section display:
- Normal stress σx (maximal and minimal)
- Shear stress - τxz
- Stress σi - values of reduced stress calculated according to a selected hypothesis (HMH, Tresca).
The coordinate value for which the extreme stress value was obtained is given for each of the listed stress values.
Note: If you selected a normal stress σx for presentation, the software displays the neutral axis (in the form of a dashed line) in the cross-section of a solid bar.