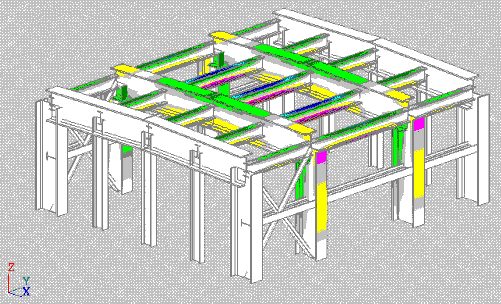
After a structure analysis is completed in Robot, you can determine stress maps obtained for the entire bar structure.
To access the Stress Analysis - Structure option:
- Click Results menu > Stress Analysis > Stress Analysis - Structure.
- Click Results layout > Stress Analysis - Structure.
The screen layout for this option displays a window for the structure view, result table, and the Stress Analysis - Structure dialog.
The result table contains numerical stress values for all typical stresses and user-defined stresses. Stresses for individual bars display in the form of extreme values for selected load cases. The global extremes for individual stress types display with the information about the bars and cases for which these extremes occur.
The dialog is used for selecting stresses and determining the manner of stress graphical presentation:
In the dialog, you can select a user-defined stress using a set of basic stress types: normal, tangent, Mises, and Tresca. For each stress type, select a set of forces to be considered during calculations. It allows you to assess the influence of individual internal forces on the bar ratio.
The lower part of the dialog is the same for all tabs. In order to obtain the stress distribution presented both in the structure view and in the tabular form:
- Select a structure load case for which stress maps will be presented.
- If All bars is selected, the stresses will be presented for all structure bars. If Selected bars is selected, you can specify bars for which calculations will be performed and maps/ diagrams will be presented.
- Select a stress type (normal, tangent, reduced). The components of internal forces used in the stress calculations (FX, FY, FZ, MX, MY, and MZ) will be selected automatically.
- Indicate the stress type to be presented in the form of diagrams.
After you have specified the parameters and clicked Apply, the software performs calculations and displays the stress values on the structure bars. The result table displays the values of the appropriate stresses.
If you change parameters in the Stress Analysis dialog, clicking Apply updates the stress values and diagrams and/or maps for the new parameters.
The Stress Analysis - structure table displays stress values for selected structure bars. To select the stress types to be displayed:
- Right-click in the table, and click Table Columns.
- In the Select quantities for presentation dialog, select the stress types.
You can choose to display minimal and maximal values for all available stress types and for user-defined stresses.
At the end of the table, a set of extreme values for the entire structure displays. For a given stress type, the following data displays:
- extreme stress value
- case for which the extreme value occurred
- bar in which this stress value occurs
- location of the extreme value on the bar length
![]() Stress Maps - click Results menu > Stress Analysis > Stress Maps to display a structure with section shapes and accurate detailed stress maps on these sections as shown.
Stress Maps - click Results menu > Stress Analysis > Stress Maps to display a structure with section shapes and accurate detailed stress maps on these sections as shown.
