Click ![]() (Panel cuts) or select Results > Panel cuts to create diagrams of internal forces and displacements in planar finite elements. This completes the Maps option
(Panel cuts) or select Results > Panel cuts to create diagrams of internal forces and displacements in planar finite elements. This completes the Maps option
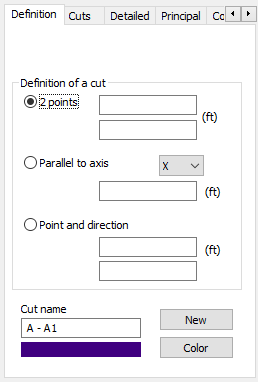
Diagrams are drawn in arbitrary user defined cuts. For two-dimensional structures, the cut is made along a straight line or a segment located in the plane in which the structure has been defined. For shells, the cut is defined by an arbitrary plane in 3D space. You can define several cut diagrams for one structure. To create a diagram of any of the available quantities of internal forces, stresses and local displacements in finite elements, it is necessary to define the line of the cut and indicate which of the available quantities is to be displayed in the diagram.
You can define more than one plane (straight line) when determining the cut. Diagrams may be drawn simultaneously for several cuts. Defining a new cut adds it to the previously defined cuts. Diagrams may be drawn as tangent or normal in respect to the plane of the cut. You can also use smoothing for element-to-element transitions.
The following tabs are available in the Panel cuts dialog.

To display a diagram of any quantity on screen, perform the following.
- Define cuts through a plate or shell structure.
- Select the quantity to be presented in a diagram.
- Determine the diagram parameters.
- Click OK.
The presented diagrams can display with smoothing as follows.
Smoothing
Results for planar FEs are determined at Gauss's points located inside each element. Results estimated at the common node of adjoining elements may differ slightly in each element, and isolines may not be continuous. To obtain a smooth map of a selected quantity, select the smoothing option. This results in averaging of the values at a node based on all the values obtained in the elements adjoining the node.
- No smoothing.
- Smoothing that does not recognize panel membership of elements but recognizes the selection of finite elements.
- Smoothing that recognizes panel membership of elements. The values at the boarder of 2 elements are to be smoothed only when they belong to one panel.
See also: