Windows > Information > History Visualizer
Shows or hides the History Visualizer window, which displays the construction history of objects in your scene as a node graph of connected input geometry and tool, and output nodes.
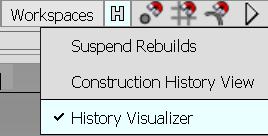
In addition to opening the History Visualizer from the Windows > Information menu, you can also open it by right-clicking on the History icon in the top right of the Alias UI.
Input geometry, tools, and the output of tool operations display in the graph area as a series of connected nodes. Construction history flows left to right from the input geometry nodes along the connections to the tool nodes to the output nodes resulting from tool operations. The History Visualizer window is made of these main areas:

1. History Visualizer menus
Provides access to viewing, building, and editing options. See History Visualizer menus.
2. Graph viewing options
Use these options to modify the graph view and how nodes display in the graph area.
Apply Filter
Lets you filter the graph view by tool node type. When you load a WIRE file, the History Visualizer populates a list of tool nodes contained in the file. Selecting a tool node from the list focuses the graph view on the specified tool node networks while dimming the view of other node networks. Click this icon ![]() to turn off the filtered view.
to turn off the filtered view.
Ensure that Fit Window is on in History Visualizer View Options (View > View Options). This way the graph view zooms in on the filtered tool nodes (see View Options). Fit Window also applies to By Layer and Selected view options.
By Layer
Lets you focus the graph view based on the layers selected in the Object Lister. For example, selecting a layer in the Object Lister automatically focuses the graph view on nodes the layer.
Selected
Displays the construction history of objects selected in the viewport.
All
Displays the construction of all objects in the viewport.
Fit window
Adjusts the width of the graph view so that all nodes connections from left to right get displayed. Depending on the complexity of the history graph, some nodes may not be visible.
Reset
Resets the graph view to default node layout.
Magnifier icon
(![]() ) - Lets you zoom into a specified area of interest.
) - Lets you zoom into a specified area of interest.
3. Input nodes
Input nodes represent the input curves or surfaces used by the tools. When a surface input node has isoparm curves connected to a tool, the isoparms are labelled on the input node using a V =
You can modify the construction history of an object by substituting the connected input nodes of geometry with other geometry in the scene. For more information, see Work with construction history using the History Visualizer.
4. Tool nodes
Tool nodes represent the tools operating on the input geometry. You can query the tools construction history by double-clicking the node or by selecting the node, then Edit > Query Edit. You can collapse tool nodes so that the inputs and outputs display as a single connection. This helps you manage space in the graph if a tool has several input and output connections.
You can suspend construction history updates on tool nodes, by selecting Rebuild > Suspend Selected. Suspended tool nodes appear in the graph with this ![]() icon above them. See Suspend and resume construction history updates for more information.
icon above them. See Suspend and resume construction history updates for more information.
You can create a history preset from a tool node, which you can then apply to other tool nodes of the same type. For more information, see Create and assign construction history presets.
5. Output nodes
These nodes represent the final results of input geometry and tool operations. If you have several output node connected to a tool, you can use View > Compress Outputs to display them as a single connected node. This can help make graph more readable and optimizes space.
6. Broken construction history
Tool nodes appear red when construction history is broken. You can fix broken construction by replacing the input with valid geometry using the Replace Input command.
Node input colors
| Node input/Node | Description |
|---|---|
 | Primary curve input |
 | Secondary curve input |
 | Auxiliary curve input |
 | Primary surface input |
 | Secondary surface input |
 | Indicates that the tool node's construction history is broken. |
 | Collapsed input or tool node |
 | Identifies a compressed group of output nodes. |
 | Highlighted node identifies it as belonging to the node network of a selected tool node. |
History Visualizer menus
View
All/ Selected
Toggles between displaying the history graph of all the objects in the scene or only the picked objects.
By Layer
Lets you focus the graph view based on the layers selected in the Object Lister. For example, selecting a layer in the Object Lister automatically focuses the graph view on nodes in the selected layer.
Fit to Window
Adjusts the width of the graph view so that all nodes connections from left to right get displayed.
Zoom
Zooms into a specified area of interest in the graph. Clicking Zoom displays a movable magnified rectangle. Click the rectangle and drag it to an area of interest. Release it to center the graph view on the area of interest.
Reset
Removes view filters and resets the graph to the default layout.
Compress Outputs
Reduces the display of output nodes from each tool node to a single, compressed node. Use this to keep the workspace neat and optimize available space.
Collapse All
Collapses the input and tool nodes view so that each node displays a single connection. Nodes with more than one input or output connection are labeled with Multiple connections. Use this to keep the workspace neat and optimize available space. Click the caret at the bottom of a node to toggle between collapsed and expanded view.
Expand All
Returns the view of all nodes to the expanded view, which is the default setting.
View Options
Lets you configure the graph view so that it automatically zooms to filtered nodes while dimming the display of other nodes in the graph. In the View Options window, turn on Fit Window to apply automatic zooming. Use the Node Tree Transparency slider to adjust the dimming of unfiltered nodes and node networks. The View Options apply when filtering nodes by tool node (Apply Filter), By Layer, and Selected. Fit Window is on by default.

See Viewing construction history.
Pan With MMB
When on, you can pan left or right in the history graph by holding down the middle-mouse button and dragging.
Hide Window on Replace
When on, the History Visualizer window closes after executing a Replace input command.
Rebuild
Global Suspend
Suspends construction history updates for all objects.
Suspend Selected
Suspends construction history updates for picked objects.
Resume
Resume construction history updates for all objects.
Edit
Query Edit
Opens the control options of the selected command node to display its construction history. This is the same as selecting Object Edit > Query Edit, and then selecting an object.
See Edit tool options.
Revert History
Select this to undo and remove history from selected tool nodes and revert any edits applied to the input geometry by the tool node. Use this option to undo and remove history on multiple tools nodes at the same time. Access Revert History while working in the graph view by right-clicking and selecting Revert from the menu that appears.
See Revert history.
Delete Selected
Deletes the selected construction history and leaves the input geometry unchanged. This does not delete the actual objects, only the construction history being maintained (the same as picking the object and choosing Delete > Delete Construction History).
Replace Selected Inputs
Lets you replace one or more inputs to a tool node. To see which nodes get affected when replacing multiple inputs to a tool node, right-click the node and hover over the Replace command in the pop-up menu. See Modify construction history by replacing input geometry.
Pick
Inputs
Pick the objects used as inputs to create the selected operations.
Outputs
Pick the objects created by the selected operations.
Presets
Create New Preset
Creates a preset of the selected tool node's construction history. Presets can be applied to tool nodes of the same type. When you create a preset, it gets saved to the designated preset directories as a .hpreset file. Access this option while working in the graph view by right-clicking and selecting Create New Preset from the menu that appears.
Assign Preset
Assigns a history preset to the selected tool node. Access this option while working in the graph view by right-clicking and selecting AssignPreset from the menu that appears.
Set Preset Directories
Opens the Set Preset Directory window where you can specify directories for storing preset (.hpreset) files. By default, a preset directory is automatically created Alias user-data directory. For example: \Documents\Autodesk\Alias\user_data\Presets. You can add a remove preset directories. They can a local or network locations, but at least one preset directory must be specified at all times.
After adding a new preset directory, you can designate it as the location which new presets get saved.
See Set file locations for presets.
Related Tasks
- Work with construction history using the History Visualizer
- Work in the History Visualizer
- Create, query edit, or delete construction history
- Work with construction history presets