In this exercise, you explore the effects of different histogram filters on a grayscale image.
| To make tonal adjustments to an image | ||
|---|---|---|
| 1 |
Open the LiveView_Histogram.dwg sample file. You see three numbered copies of a grayscale aerial photo in which some areas are too light and others too dark. |
 |
| 2 |
Select image 1 and zoom in on it. On the ribbon, click
Raster Tools tab If prompted to proceed, click Yes. Press Enter to process the entire image. |
 |
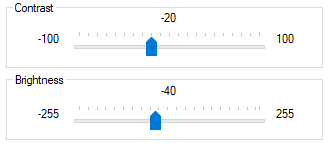
| 3 | In the Histogram dialog box, click the Brightness/Contrast tab. Adjust the Brightness and Contrast sliders, noting the effects in the Preview. Choose a setting that improves the image visibility. Click Apply, then click Close. |
 |
| 4 | Select image 2, and repeat Step 2 to open the Histogram dialog box. This time, click the Equalize tab. Click Apply to equalize the image, then click Close. |
 |
| 5 |
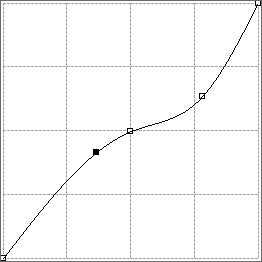
Select image 3, and repeat Step 2 to open the Histogram dialog box. This time, click the Tonal Adjustment tab. In the graph window for the fitted curve, click on the diagonal line above and below the midpoint to add two more control points. Adjust the position of the control points to lighten the dark areas and darken the light areas. Click Apply, then click Close. |
 |
| 6 | If you want to try using different histogram controls to edit the image, insert additional copies of the image. To do this, ensure that Image Manager is open (if necessary, on the ribbon, click
Raster Tools tab  Manage & View panel
  Manage). On the Image Manager, click the drop-down list and choose
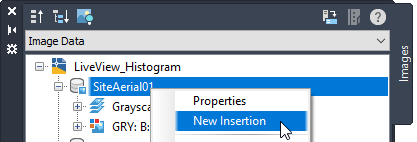
Image Data. Expand the LiveView_Histogram node, right-click SiteAerial01 and choose
New Insertion.
A new insertion is created over top of image 1. Move the new insertion to a different location in the drawing. |
 |