Use this tab to edit settings for vertical scale.
Vertical Scale
Use the controls in this area to specify the elevation values, in order to improve visibility in the section view. Specify the section view vertical scale in either of the following ways:
- By Vertical Exaggeration — Enter a value in the Vertical Exaggeration field. The Vertical Scale value is calculated automatically.
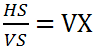
The Current Horizontal Scale (HS) factor of the drawing is divided by the Vertical Scale value (VS) to obtain the profile view Vertical Exaggeration value (VX).
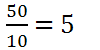
For example, if the Current Horizontal Scale is 50, and you want the profile view’s Vertical Scale to be 1”=10’, then set the Vertical Exaggeration to 5.
- By Vertical Scale — Select a scale from the Vertical Scale list. Alternatively, enter a custom value in the Custom field. The Vertical Exaggeration value will be calculated automatically.
- Vertical Scale
-
The section view vertical scale. Select a vertical scale from the list, or enter a custom scale in the Custom Scale field.
Vertical Scale (VS) = Current Horizontal Scale (HS) divided by Vertical Exaggeration (VX)

- Custom Scale
-
Specifies the current Vertical Scale factor. Enter a value in this field to specify a scale factor that is not provided in the Vertical Scale list.
- Current Horizontal Scale
-
The overall drawing Scale specified in the Drawing Settings dialog box. This field is not editable. The horizontal scale must be changed in the Drawing Settings dialog box.
- Vertical Exaggeration
-
Specifies by how much the elevation values increase in the section view for greater visibility. Enter either 1 for no increase in scale or a larger number to increase the scale. The elevation values are multiplied by this value, so a larger number increases the amount of exaggeration in the section view.
Section View Direction
Specifies the direction of the section in the section view grid. This control is useful when plotting sections of rivers, where the left bank needs to appear on the left side of the plotted sections and the sections need to be oriented to look downstream, regardless of the direction of the alignment.
- Left To Right
 : The section is drawn as if the viewer is positioned at the lowest station on the alignment and looking toward the highest station. When you select this option, the alignment offsets are labeled with positive values on the right and negative values on the left.
 - Right To Left
 : The section is drawn as if the viewer is positioned at the highest station on the alignment and looking toward the lowest station. When you select this option, the alignment offsets are labeled with negative values on the right and positive values on the left.