Use this dialog box to specify the settings to use when creating a profile by best fit through a series of objects.
Input Data
- Input Type
-
Specifies the type of source objects (AutoCAD Blocks, AutoCAD 3D Polylines, AutoCAD Points, COGO Points, or Surface Profile, Feature Lines) from which to create the best fit profile.
- Weeding Options
-
Opens the Best Fit Profile Weeding Options dialog box, which enables you to specify options for adding or removing vertices when using either feature lines or AutoCAD 3D polylines as the input data.
- Path 1
-
Specifies that the profile is created through a single path of regression points.
Use this option to create a profile from centerline sample data.
- Path 2
-
Specifies that the profile is created between two paths of regression points.
Use this option to create a centerline profile between sample data of the either the edges of pavement of a road, or the left and right rails.
Best Fit Options
These options affect the manner in which the best fit algorithm is applied to the input data.
- Maximum Radius For Curve Detection
-
Specifies the largest acceptable radius of curves that are created from the input data.
Note: This value is an estimate. For best results, specify a value that is slightly greater than the largest known radius in the input data. - Curve Type
-
Specifies the type of curve (either Parabola or Circular Arc) that are created between the tangents.
- Profile Draw Method
-
- Above Only: Specifies that the best fit profile will be drawn above the elevations of the input data.
In the following illustration, the best fit profile is drawn above the input data (a surface profile).

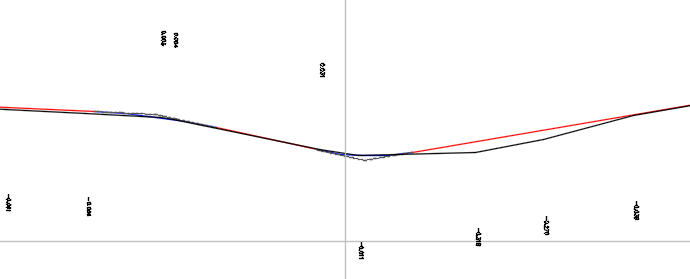
- Allow Above and Below: Specifies that the best fit profile will be drawn above and below the elevations of the input data.
In the following illustration, the best fit profile is drawn above and below the input data (a surface profile).
- Above Only: Specifies that the best fit profile will be drawn above the elevations of the input data.
Creation Settings
- Alignment
-
Specifies the name of the parent alignment. Each alignment must have a unique name.
- Profile
-
Specifies the name of the profile. Each profile must have a unique name.
- Profile Style
-
Displays the current style. Click the arrow to select another profile style.
- Layer
-
Displays the layer on which the profile object is created. Click the arrow to select another layer.
- Show Report
-
Opens the Best Fit Profile Report vista, which lists the results of the best fit regression, including the coordinates of each regression point.
- Label Offsets
-
Creates labels in the drawing that show the Offset to Entity information that is displayed in the Best Fit Profile Report vista.
The labels show the elevational difference from the best fit profile to the input data (entities).
Note: These labels use the Standard text style at a height of 1.00, and they are created on layer 0.