View and Interpret the Results
Helius PFA generates several state variable outputs available for viewing.
After the solution has completed, click Main Menu > General Postproc.
To view the true deformation scale, click Utility Menu > PlotCtrls > Style > Displacement Scaling. Select the 1.0 (true scale) radio button in the dialog box that appears and click OK.
State variable SVAR2 represents the matrix failure index for the composite material and is an indicator of how close the matrix is to failure. When SVAR2 is greater than or equal 1, the matrix failure index is satisfied and matrix failure is predicted. To plot this variable, either the PLESOL or the PLNSOL commands may be used. The PLESOL contour plot does not average values across element boundaries while the PLNSOL contour plot does average values across element boundaries. Since the values of SVAR2 are continuous, rather than discrete, the PLNSOL plot is the most useful.
Note: To view SVARs greater than 11, power graphics must be turned off using the /GRAPHICS, FULL command.To plot SVAR2 using a PLNSOL contour plot, first enter SET, LAST into the command prompt, then enter PLNSOL,SVAR,2. The default plot will plot the bottom section point of the bottom layer and the top section point of the top layer. The contour plot should be similar to the plot shown below. Minor differences are usually the result of mesh variations.
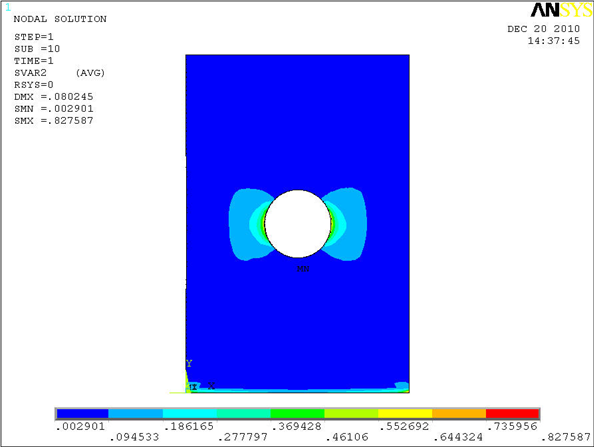
Note the maximum value of SVAR2 in ply 1 is 0.83, which occurs on the bottom surface due to the boundary conditions. Ignoring the boundary condition stress concentration, the largest value of SVAR2 is approximately 0.55 and occurs at the notch stress concentration. Since the maximum value of SVAR2 near the notch is less than 1, matrix failure is not predicted to occur in ply 1.
To view results in a specific ply (or layer) of the composite plate, the LAYER command can be used.
Enter LAYER,2 in the command prompt to view results in ply 2 (90 degree ply).
Note: It may be necessary to click Utility Menu > Plot > Replot to refresh the Graphics Window. The results for ply 2 are shown below.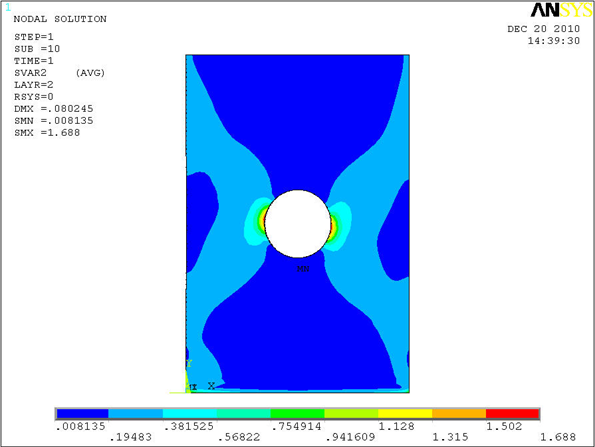
In ply 2, the maximum value of SVAR2 is 1.69, which means that matrix failure is predicted to occur in ply 2. To determine when matrix failure is first predicted to occur, progress through the sets until SVAR2 is greater than 1. Commands to view results at specific points in time can be accessed from Main Menu > General Postproc > Read Results or using the SET command.
Starting at Substep 1, progress through the step while refreshing the Graphics Window to determine when failure initiates in ply 2.
- Enter the commands, SET,1,substep#1 or
- Main Menu > General Postproc > Read Results > By Load Step 1.
- The matrix failure criterion is satisfied at time = 0.8.
SVAR3 represents the fiber failure criterion. When the value of SVAR3 is greater than or equal to 1, fiber failure is predicted.
At time = 1.0, issue the command PLNSOL, SVAR, 3.
Review each layer using the LAYER command and note that all of the values of SVAR3 are less than one, which means fiber failure is not predicted to occur in the plate.