View and Interpret Results
When you run an analysis with Helius PFA, Nastran produces the PFA Damage State variable in the output results. This variable tracks the progression of fiber and matrix constituent failure within an element. To view these results in Nastran Editor:
- Switch to the Model and Results tab.
- If the results have not been loaded, click File > Load Results and navigate to the directory containing the Tutorial_1_Nastran.fno file. Click Open.
- Expand the Results node and locate PFA DAMAGE STATE for Increment 26 in Ply - 4 (Results > Increment 26 > Composite Results > Ply - 4 > PFA DAMAGE STATE). Ply - 4 represents a ninety degree ply.
- Right-click PFA DAMAGE STATE and select Assignment.
Since the value of PFA DAMAGE STATE is a discrete real value between 1 and 4, it is useful to change the contour plot settings so that a unique color contour is associated with each discrete integer value of PFA DAMAGE STATE. In the case of this model, where PFA DAMAGE STATE can assume values of 1.0, 2.0, or 3.0, adjust the number of contour levels so that only three colors are shown.
- Click Setup > Default Settings.
- Select Post-Processing.
- Change the number of contour levels to 4 and change the contour type to Fringe.
- Adjust the Color Bars as necessary so that 1.0 = Blue, 2.0 = Green, and 3.0 = Red
- Change the Data Conversion to Center Value and deactivate the Display Labels check box.
- Click OK.
- Right-click the display window and activate Element Edges.
- Right-click PFA DAMAGE STATE in the Results tree and select Min/Max Values. Change the Data Max to 3 and click Display.
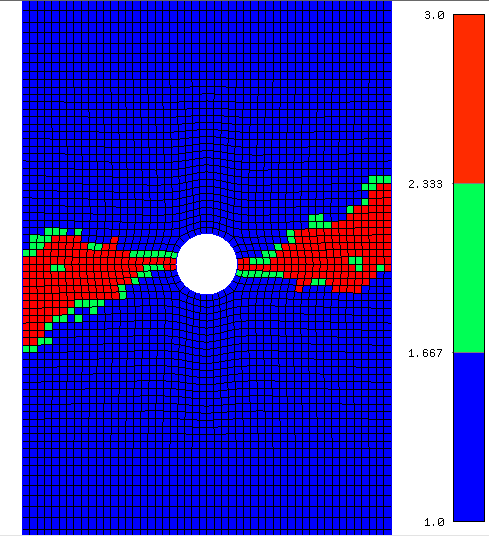
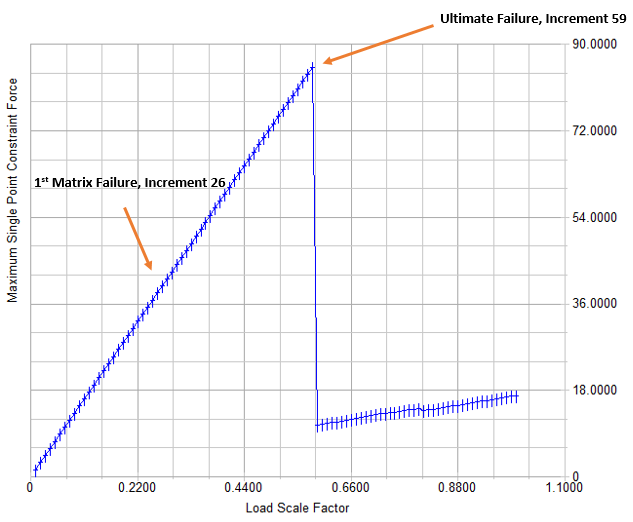
We see that Increment 26 represents the first matrix failure in the plate (PFA Damage State = 2).
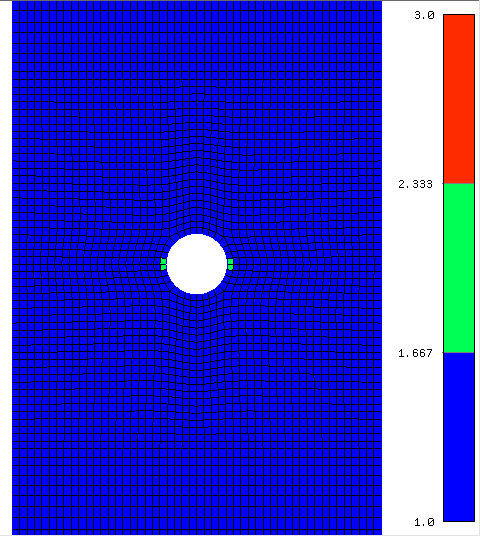
Repeat the steps above to examine how failure propagates through the model. In Increment 59, fiber failures have stretched across the width of the plate for all of the load carrying zero degree plies. If we compare PFA DAMAGE STATE with the Maximum Single Point Constraint Force vs Load Scale Factor plot, we can identify total failure for the plate. Notice that total failure occurs well after the initial matrix failure in the model.