- Use the Frame Analysis environment to perform basic analysis of frame structures. Also use it to define boundary conditions (constraints and loads) and various connections between the nodes and beams (releases, rigid links).
- Open an assembly that contains frame structures inserted using Content Center or Frame Generator.
- On the ribbon, click Environments tab
 Begin panel Frame Analysis
  . The assembly is automatically simplified to a beam calculation model. The graphics window displays beams, nodes, and the gravity glyph. The Status folder displays the insufficient beam materials and cross sections.
 - Click Frame Analysis tab Manage panel Create Simulation
 . In the Create New Simulation, set the simulation properties, and click OK. An assembly can keep multiple simulations with different properties.
 - Beam Properties are based on the assembly data, but you can customize them for the simulation. On the ribbon, click Frame Analysis tab Beams panel Properties
 . Check the Customize box, enter the desired values, and click OK. List of sections with overridden beam section properties is displayed in the Sections folder in the browser.
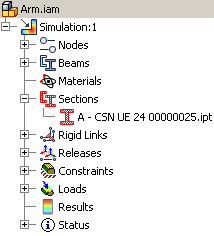
- Beam Material can be customized as well, to fine-tune the material values. To change the material, on the ribbon, click Frame Analysis tab Beams panel Material
 . Check the Customize box, use the drop-down list to select a desired material, and click OK. List of materials with overridden materials is displayed in the Materials folder in the browser.
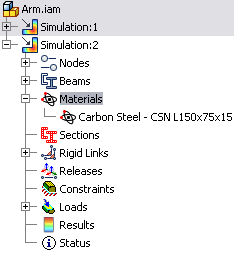
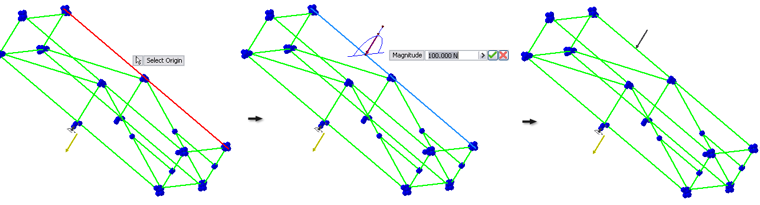
- All constraints and loads use Heads Up Display and grips to define the inputs easily. More complex settings are available in the dialog boxes. (To display the particular dialog box, right-click the graphics window after you execute the command from the ribbon, and select More Options.) To avoid unnecessary usage of complex constraints and loads, typical simplified cases use appropriate simplified commands.
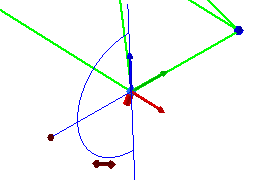
- Specify constraints. Select beam or node to specify their origin. Use glyphs or dialog boxes to specify the origin and values such as Magnitude or Angle in Plane.
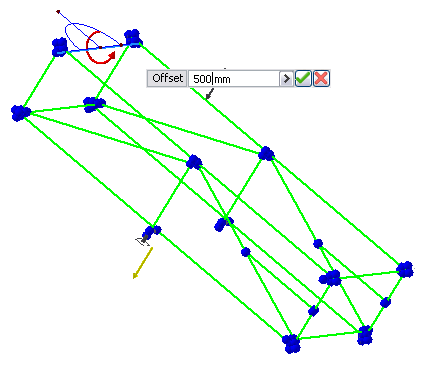
- A similar interactive approach is used to define the loads. The HUD always corresponds to the currently selected grip. Enter an exact value of the given parameter directly. Define Offset using absolute or relative values.
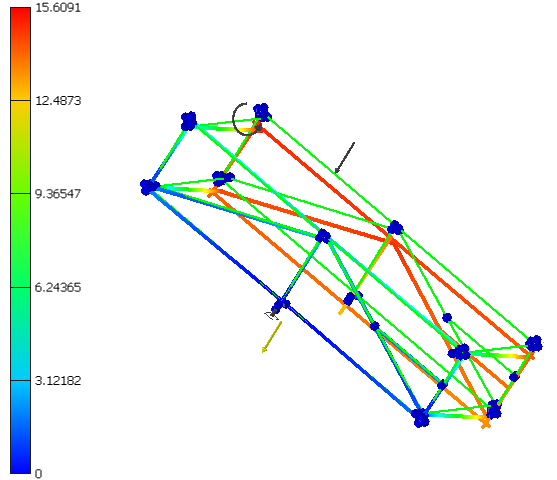
- When the loads and constrains are defined, click
 Simulate to generate accurate results. By default, the simulation scene displays the displacement values.
 - The Results incorporate different kinds of output properties. Selection of a browser node displays the appropriate results.
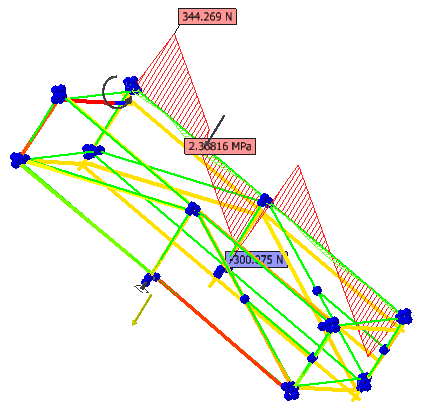
- To display important results for given beams, you can add user-defined diagrams to the graphics window. On the ribbon, click Frame Analysis tab Result panel Diagram
 . You can adjust the display of beam diagrams in the Diagram Scales dialog box. In the browser, select Diagrams, right-click, and select Diagram Scales
  .
. 
- You can easily animate the results. On the ribbon, click Frame Analysis tab Result panel Animate
 .
. - You can customize the Color Bar to fulfill your needs. On the ribbon, click Frame Analysis tab Display panel Color Bar
 .
. - Report includes all the simulation data and outputs. To create a report, click
 Report on the Publish tab.
You can also edit the simulation properties. You can change Static analysis to a Modal Analysis. Modal analysis provides modal frequency results. To change the simulation properties, select the Simulation node in the browser, right-click, and select Edit Simulation.
Individual simulations can use different positional representations of the assembly. The beam placements differ.