A theme varies the display of individual features based on data values. For example, if you theme by parcel value, less expensive parcels can be a lighter color while more expensive ones are a darker shade.
In this exercise, you create a theme based on the calculated property you defined for ValueByArea.
To create a theme using a calculated property
- In Display Manager, select the Parcels layer and click Style.
- In the Style Editor, click New Theme.
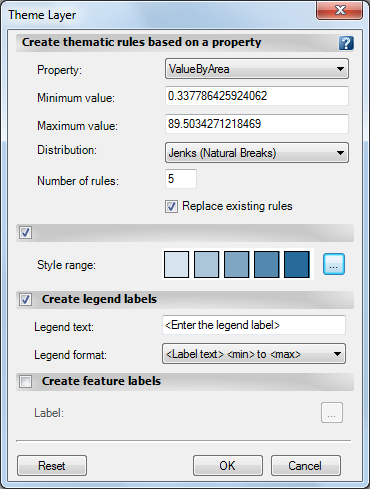
- In the Theme Polygons dialog box, for Property, select ValueByArea.
- For Distribution, select Jenks (Natural Breaks).
The Jenks distribution method groups ranges of features at their natural breaks so that features with similar values are grouped. This method shows the natural groupings in the data, rather than creating arbitrary breaking points.
- Under Theme The Polygons, click
 next to Style Range and set the Fill Color range to any two colors.
 - Select the fill element for the style (the bottom element under Symbol And Style).
- Under Fill Color, click the down arrow for each of the color selections and choose two new colors.
The Style Range is a gradient between two colors you specify.
- Click OK twice to return to the Style Editor.
Leave the Style Editor open for the next exercise.
To continue this tutorial, go to Exercise 2: Add labels that use an expression.