- Select
Display > Polygons > Metadata > Visualize Metadata >
 to set your metadata visualization options.
Metadata displays based on what you set in the Metadata Visualization Options.
You can also select
Metadata > Visualize Metadata >
from the marking menu to open this window.
See also Visualizing metadata in Viewport 2.0.
- Stream to visualize
- All metadata streams that belong to your scene are displayed in this drop-down list. Select the stream that you want to visualize.
Note: You can also select your stream directly from Metadata > Select Stream in the marking menu.
- Member
- All members that belong to the stream you selected are displayed in this drop-down list. Select the member that you want to visualize.
Note: You can also select the member directly from Metadata > Select Stream > <your stream> in the marking menu.
- Method
-
You can visualize metadata in 3 modes:
-
Color
The displayed colors range from 0.0 (black) to 1.0 (white). Booleans are displayed in white or black, while integers and floats are displayed grayscale. Vectors (3 integers or 3 floats) are displayed as RGB color.
For a vector of 2 floats/integers, the float/integer values are mapped to the R and G values respectively. The Blue value is set to 0. For a single float/integer, the same value is mapped to all of RGB. For an array of 4 or more floats/integers, only the first three values are mapped and all other values are ignored.
When visualized, vertices/edges/vertex faces with metadata assigned are displayed larger and thicker than those that are selected but without metadata assigned.
-
String
The metadata values are displayed as strings above the component.
-
Ray
The metadata values are displayed as a ray emitting from the center of the component. Rays are drawn on top of other display components such as displayed vertices.
For a single float/integer, a ray is drawn emitting from and perpendicular to the center of the component. The length of the ray represents the metadata value, and the color of the ray is white.
For a vector of 3 floats/integers, the direction of the ray represents the metadata value, and the length of the ray represents the magnitude of the vector. For example, metadata values of (1, 1, 1) and (2, 2, 2) both emit a ray from the component with a direction of (1, 1, 1). However, the ray representing (2, 2, 2) is twice as long as that of (1, 1, 1). For a vector of 3 floats/integers, the color of the ray is dark red.
For a vector of 2 floats/integers, the float/integer values are mapped to the X and Y values respectively while Z is set to 0. For an array of 4 or more floats/integers, only the first three values are mapped and all other values are ignored.
-
Color
Color method
The following options appear if you select Color as your visualization method.
Color interpretation from
You can remap the color range to control how your values are represented as color.
Select from among four options:
- 0-1
- A value of 0 is mapped to black, and a value of 1 is mapped to white. All values are clamped to this range. This method is most useful for boolean and float metadata values.
- 0-255
- A value of 0 is mapped to black, and a value of 255 is mapped to white. All values are clamped to this range. This method is most useful for integer metadata values.
- Automatically remap data range
-
Maya searches for the minimum and maximum values from the stream that is currently visualized and uses the same color range for all data channels.
For example, if you have two data assignments, one with values (0.25, 0.5, 1.75) and one with values (0.8, 2.0, 1.1), as shown below, then the minimum is set to (0.25, 0.25, 0.25) and the maximum is set to (2.0, 2.0, 2.0).
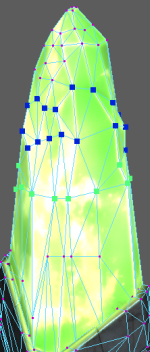
The minimum value is interpreted as black and the maximum is interpreted as white. In other words, if you now add metadata values of (0.25, 0.25, 0.25) and (2.0, 2.0, 2.0) to the stream above, these are displayed as black and white, respectively.
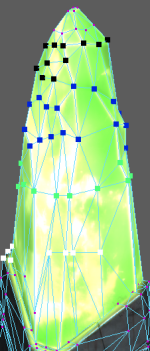
All other values are interpreted relative to the new minimum. For example, the vector (0.25, 0.5, 1.75) is now interpreted relative to a 0.25 to 2.0 scale, and not relative to a 0 to 1 scale. The R and G values are at the low end of the 0.25-2 scale while the B value is at the high end of the 0.25-2 scale. Therefore, the vertices are displayed mainly as blue.
Likewise, when interpreted on a 0.25-2 scale, the vector (0.8, 2.0, 1.1) has a dominant G value. The vertices are therefore displayed mainly as green.
- Custom remapping range
- Set the range values as desired in the Lower range and Upper range fields. The same color range is used for all data channels. All values below the minimum are displayed as black and all values above the maximum are displayed as white.
Enable color interpolation on faces
When visualizing metadata on vertices or vertex faces, you can enable this option to extrapolate the color to the faces surrounding the vertices/vertex faces. This functionality helps you to better understand how your data is distributed across the surface.
Ray method
The following option appears if you select Ray as your visualization method.
Ray length scale
If you find that the default ray length that represents the metadata value is too short or too long, you can scale it using this attribute. This is a universal scale value for all of your rays.