Temperature at flow front result
The Temperature at flow front result, which is produced by a Fill analysis, shows the temperature of the polymer when the flow front reaches a specified point in the center of the plastic cross-section.
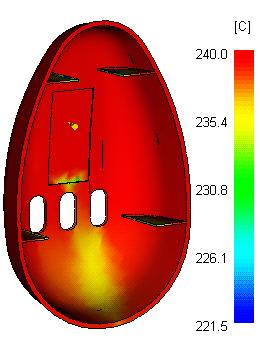
As shown in the following diagram, the Temperature at flow front result uses a range of colors to indicate the region of lowest temperature in blue through to the region of highest temperature in red. The colors represent the material temperature at each point as that point was filled. The result shows the changes in the temperature of the flow front during filling.
The flow front temperature should not drop more than 2°C to 5°C during the filling phase. Larger changes often indicate that the injection time is too low, or there are areas of hesitation. If the flow front temperature is too low in a thin area of the part, hesitation may result in a short shot. In areas where the flow front temperature increases by several degrees, material degradation and surface defects may occur.
Using this result
Minimize the flow front temperature variation in the filling phase to under 2-5°C. Smaller temperature variations cause fewer problems.
If the Confidence of fill result is poor, use the Temperature at flow front result to see whether the problems are caused by low melt temperatures.
- Filling profiles may be required to obtain satisfactory temperature distribution during the filling phase.
Try changing the following settings to improve the result, using the information in the table below to check whether a change has introduced other problems.
Things to look for
When viewing the Temperature at flow front result, watch for the following:
- Hot spots; usually these exist around the gate and in areas where excessive shear heating occurs.
- Cold spots indicating hesitation.
- Check whether the material is shear heating or cooling excessively?